Impact DashBoard Knowledge Base
Review Reports
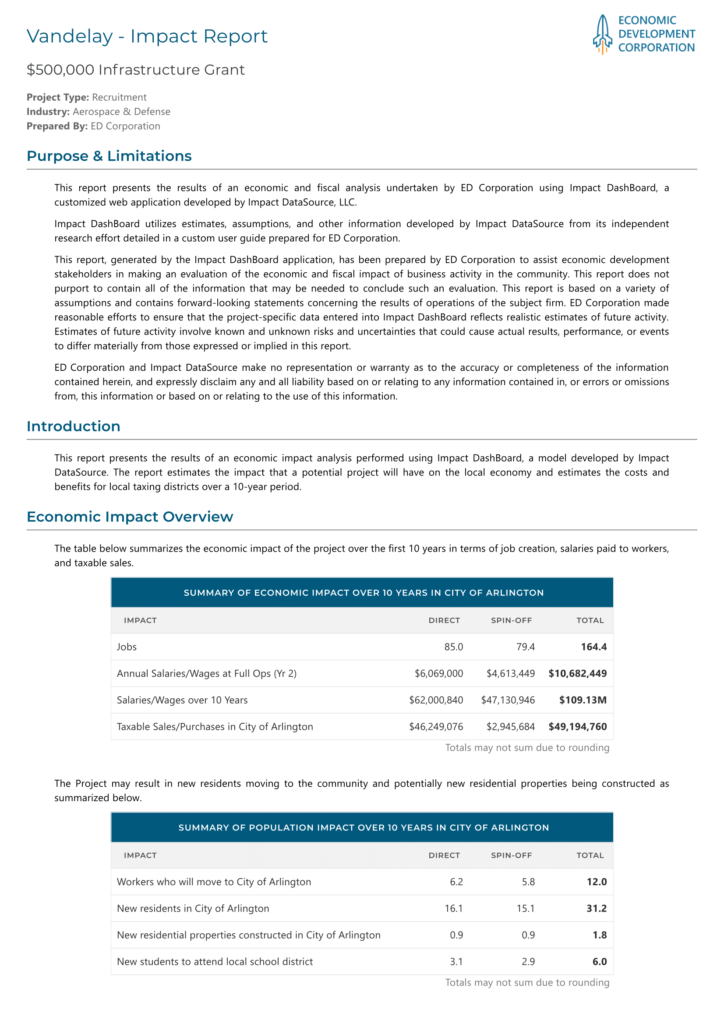
Summary Report
Summary Reports are one-page infographic reports that summarize the economic impact, fiscal impact of the project and, if applicable, present an analysis of the incentives. A Summary Report is available for each Taxing District included in the Scenario and can be found on the Report page.
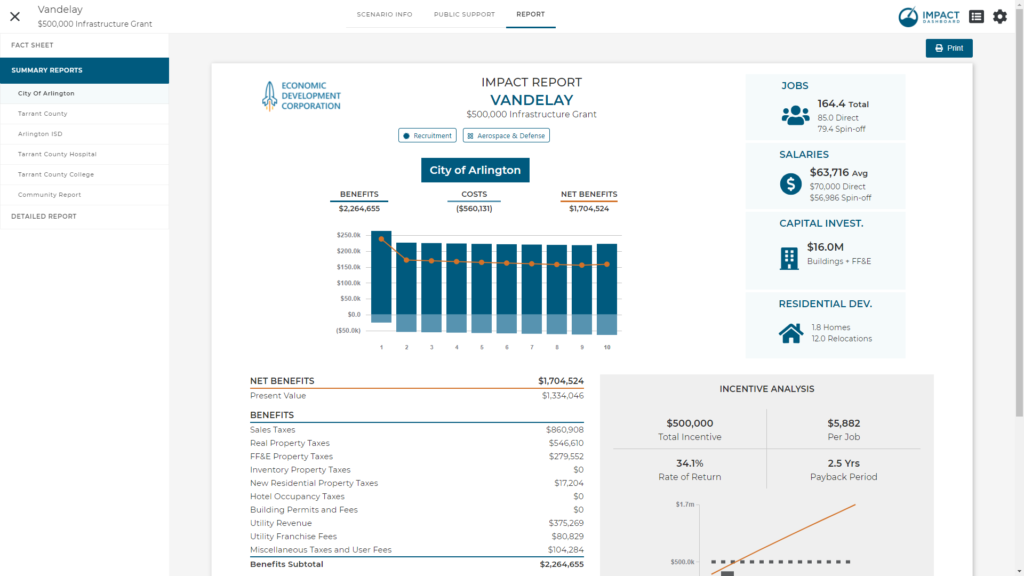
The one-page infographic format of the report means we pack a lot of information in a small space. What may look like a lot of information is not as overwhelming when you realize this report is hitting the three connected elements of an economic development project.
Economic Impacts
Jobs, salaries, capital investment, and residential development are the primary economic impacts summarized in this report. Job creation includes breakouts for direct jobs, indirect and induced jobs or “spin-off” jobs, and total jobs. Average salaries for direct, spin-off, and the aggregate total of all new jobs are also shown. The direct impacts are entered by the user based on information about the prospective project and the indirect and induced impacts are estimated using economic impact multipliers. Typically, our models use RIMS II multipliers from the Bureau of Economic Analysis but the user has the ability to use other multiplier values if desired. Capital investment represents the total amount invested in buildings and furniture, fixtures, and equipment (“FF&E”) over the term of the analysis. Residential development highlights the number of worker households anticipated to relocate to the community (“Relocations”) and the number of new residential properties to be constructed (“Homes”).
Fiscal Impacts
The economic impacts that emanate from the new economic development project generate new tax revenues and will likely result in new costs. Impact DashBoard is configured to model your community’s tax structure and parse out which government receives various local or state tax revenue. Furthermore, Impact DataSource researches the cost of government services to be estimated based on an increase of business activity or residential population. Impact DashBoard estimates these fiscal costs and benefits over multiple years to capture the dynamic effects of the project’s phase-in or changes expected over time. The Summary Report shows the revenues and costs for a single Taxing District.
Incentive Analysis
If incentives are under consideration, a comprehensive analysis must incorporate how potential incentives affect the fiscal net benefit to be generated by a project. Impact DashBoard allows users to model several types of tax incentives as well as other non-tax incentives such as paid-for infrastructure improvements, discounted land, or other cash or near-cash grants. Impact DashBoard estimates property tax incentives to determine how these incentives reduce the overall net benefit generated by the project. Impact DashBoard also calculates the ROI for economic development incentives. A non-tax incentive is compared to the stream of net benefits to be generated over time. In this way, the non-tax incentive is treated as an investment and the net benefits are the return on investment. Impact DashBoard calculates the rate of return and payback period on these incentives.
Community Report
The Community Report is one-page infographic report that summarize the economic impact, fiscal impact of the project and, if applicable, present an analysis of the incentives. Unlike a basic Summary Report presents the impact of just a single Taxing District, the Community Report can be configured to summarize the impact of multiple Taxing Districts.
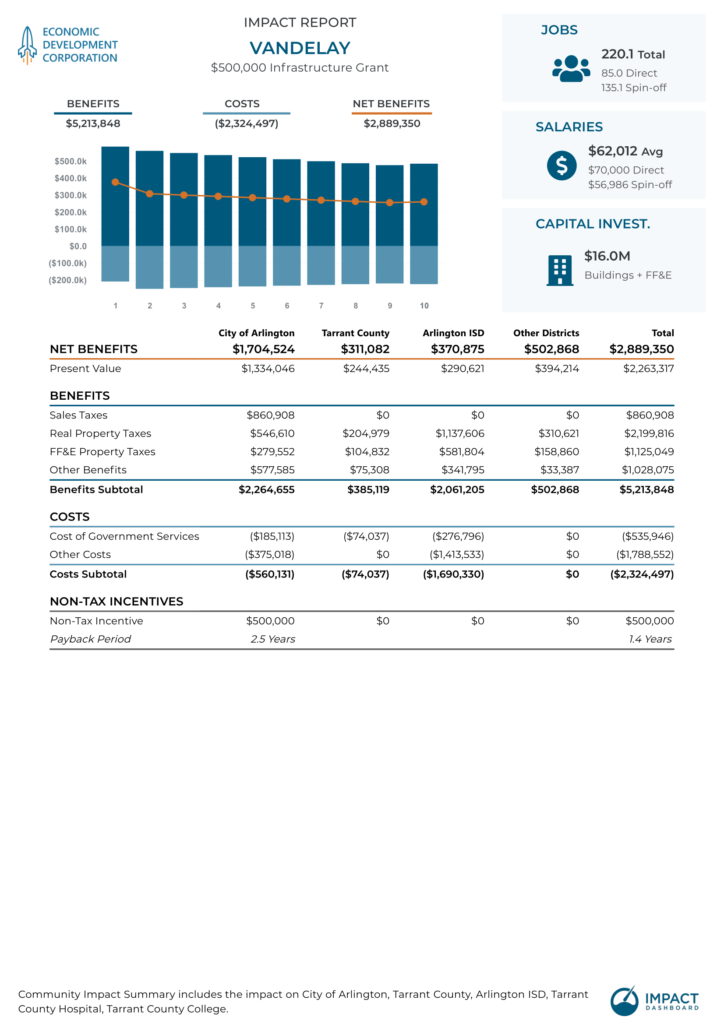
The Community Report allows you to create a custom one-page infographic for any combination of districts included in your analysis. For example, the Community Report allows you to summarize results for the city and the county on one page. The report can be configured in a number of different ways so you can aggregate the impact for however many districts you choose. You may choose to include all of the districts in your Scenario in your Community Report.
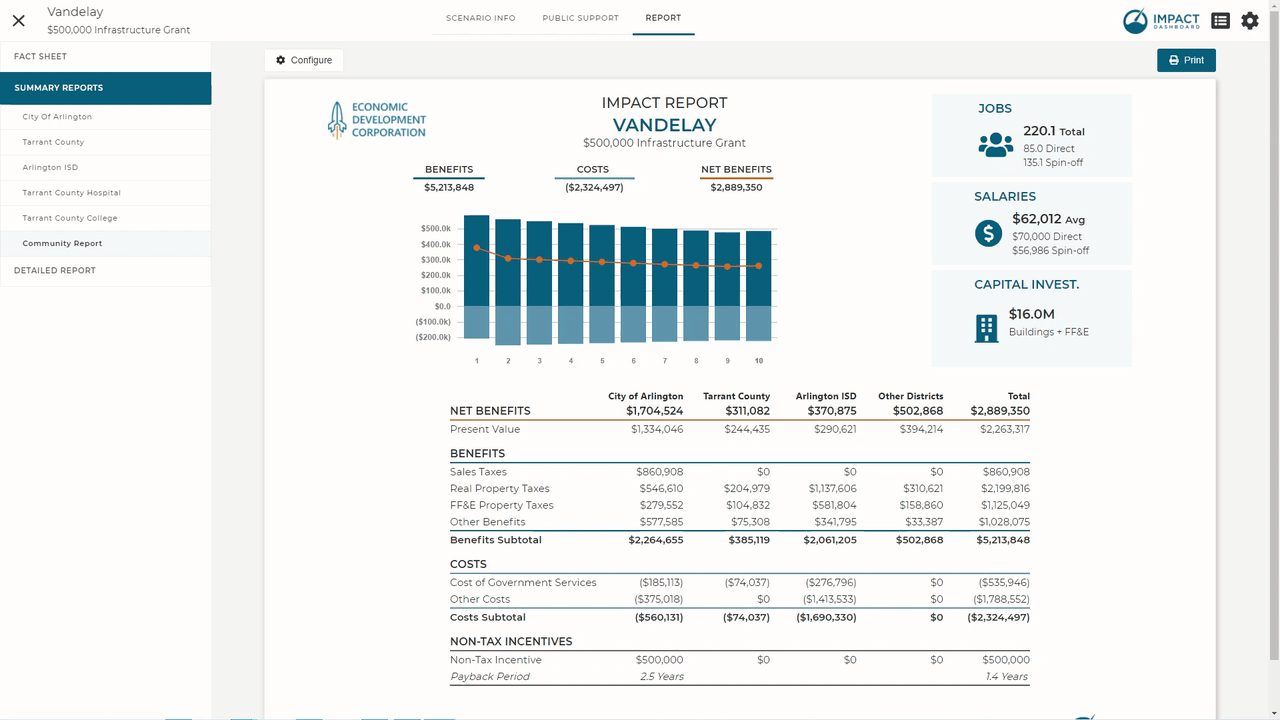
To Configure the Community Report, look for the Configure button at the top of the page. After clicking on the Configure button, you’ll be able to select the Taxing Districts to be included in the Community Report.
Detailed Report
The Detailed Report is a multi-page report that includes information on all key aspects of the analysis. The Detailed Report includes the economic impact, fiscal impact, and incentive analysis for each Taxing District included in the analysis. In addition, several Overview sections summarize the combined impact across all Taxing Districts.
The left side tab menu doubles as a section outline with links to individual sections. A comprehensive description of the Detailed Report can be found here.