
We recently added a feature to Impact DashBoard that gives users more control over tax increment calculations for evaluating projects in a TIF district. The basics are described below but feel free to reach out for a one-on-one explanation and help entering your community’s existing TIF districts.
Tax Increment Financing
Users can now easily model incremental property taxes contributed to a TIF District. Here’s how you can do it:
1. Enter your project data just like normal on a project’s Scenario Info page.
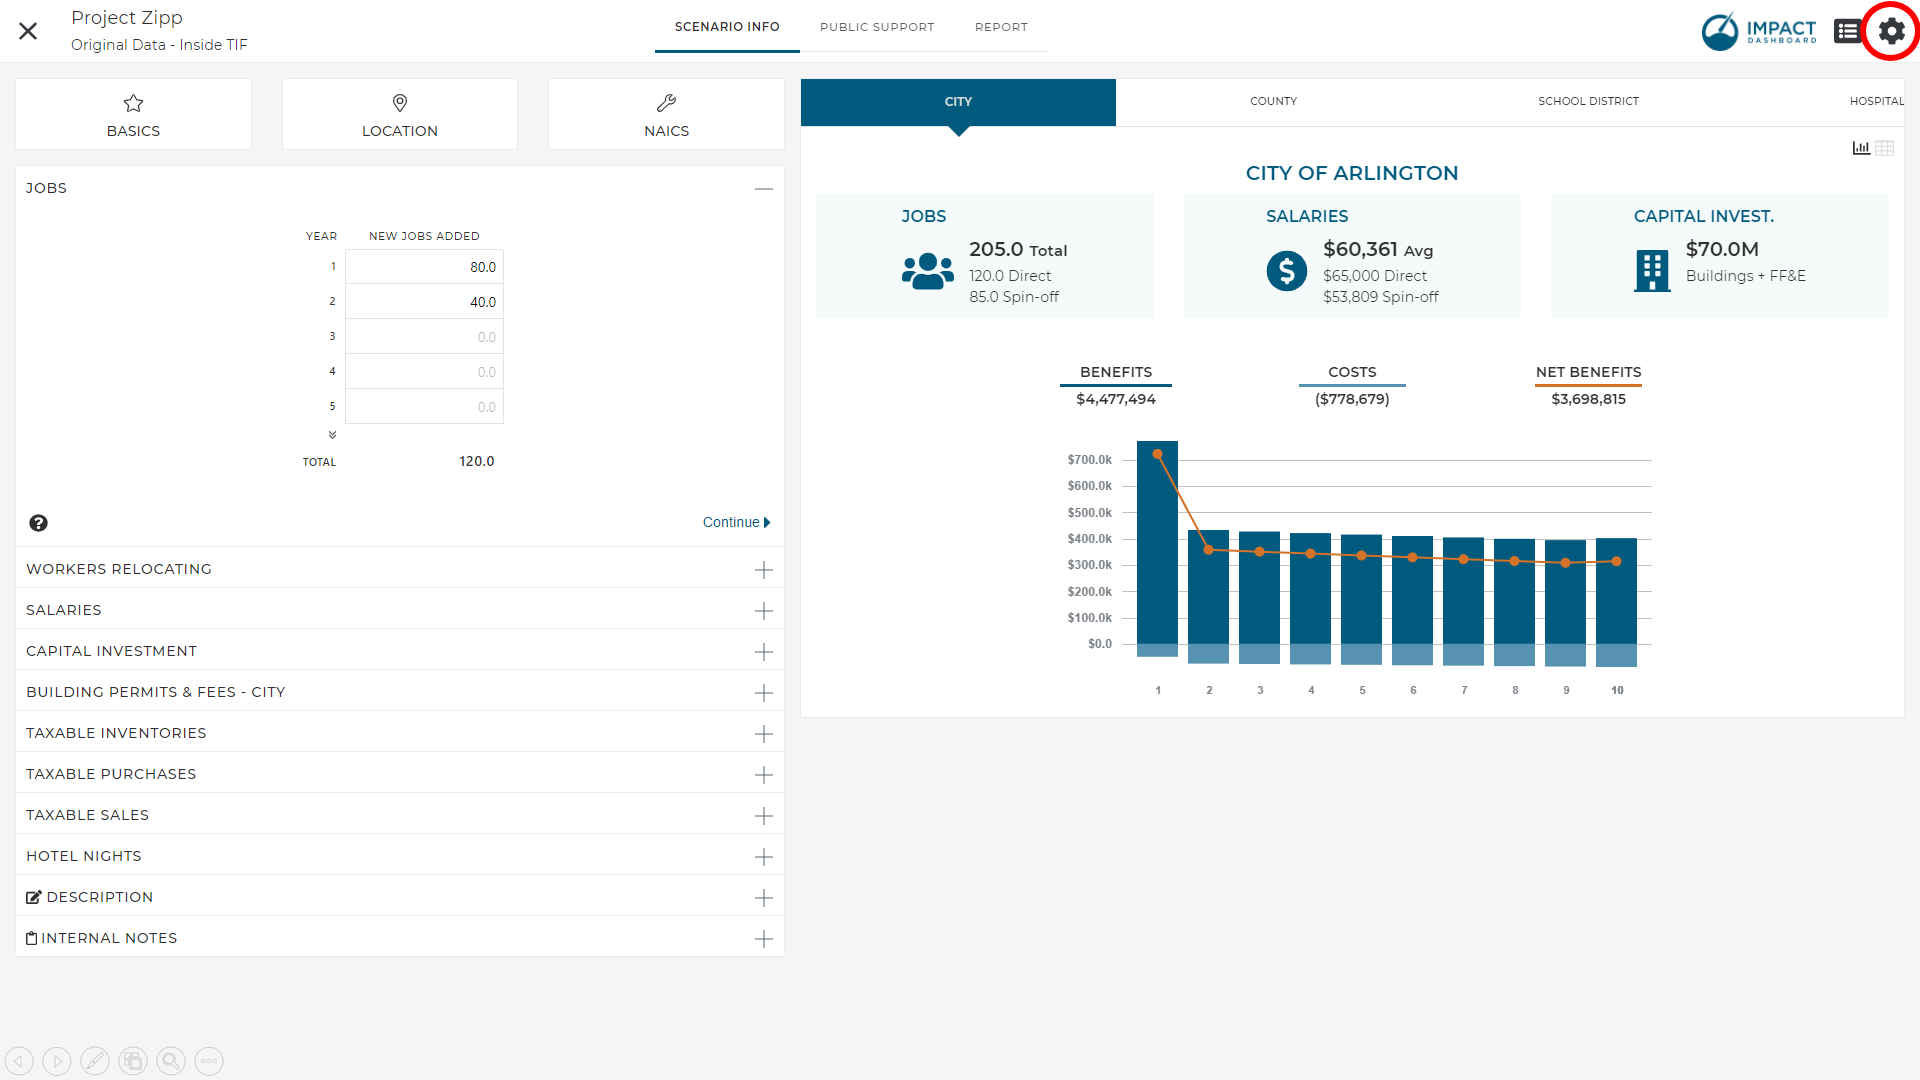
Enter all project data in the scenario as you normally do. The new TIF feature will allow you to specify the amount of incremental property tax contributed to the TIF District. TIF contributions are based on the incremental property which is perfect because that’s what you are entering in the capital investment/property sections. There is no need to enter the base value anywhere because we are focused on the net impact of the project – the taxes on the base value aren’t an issue. What we want to do is identify the portion of incremental taxes contributed to the TIF district by each taxing district. We created an area for you to specify the portion of incremental taxes contributed to the TIF district by each taxing district. Click on the Gear Icon/Settings button in upper right corner of the scenario.
2. Specify the portion of incremental property taxes contributed to the TIF District in the Settings area.
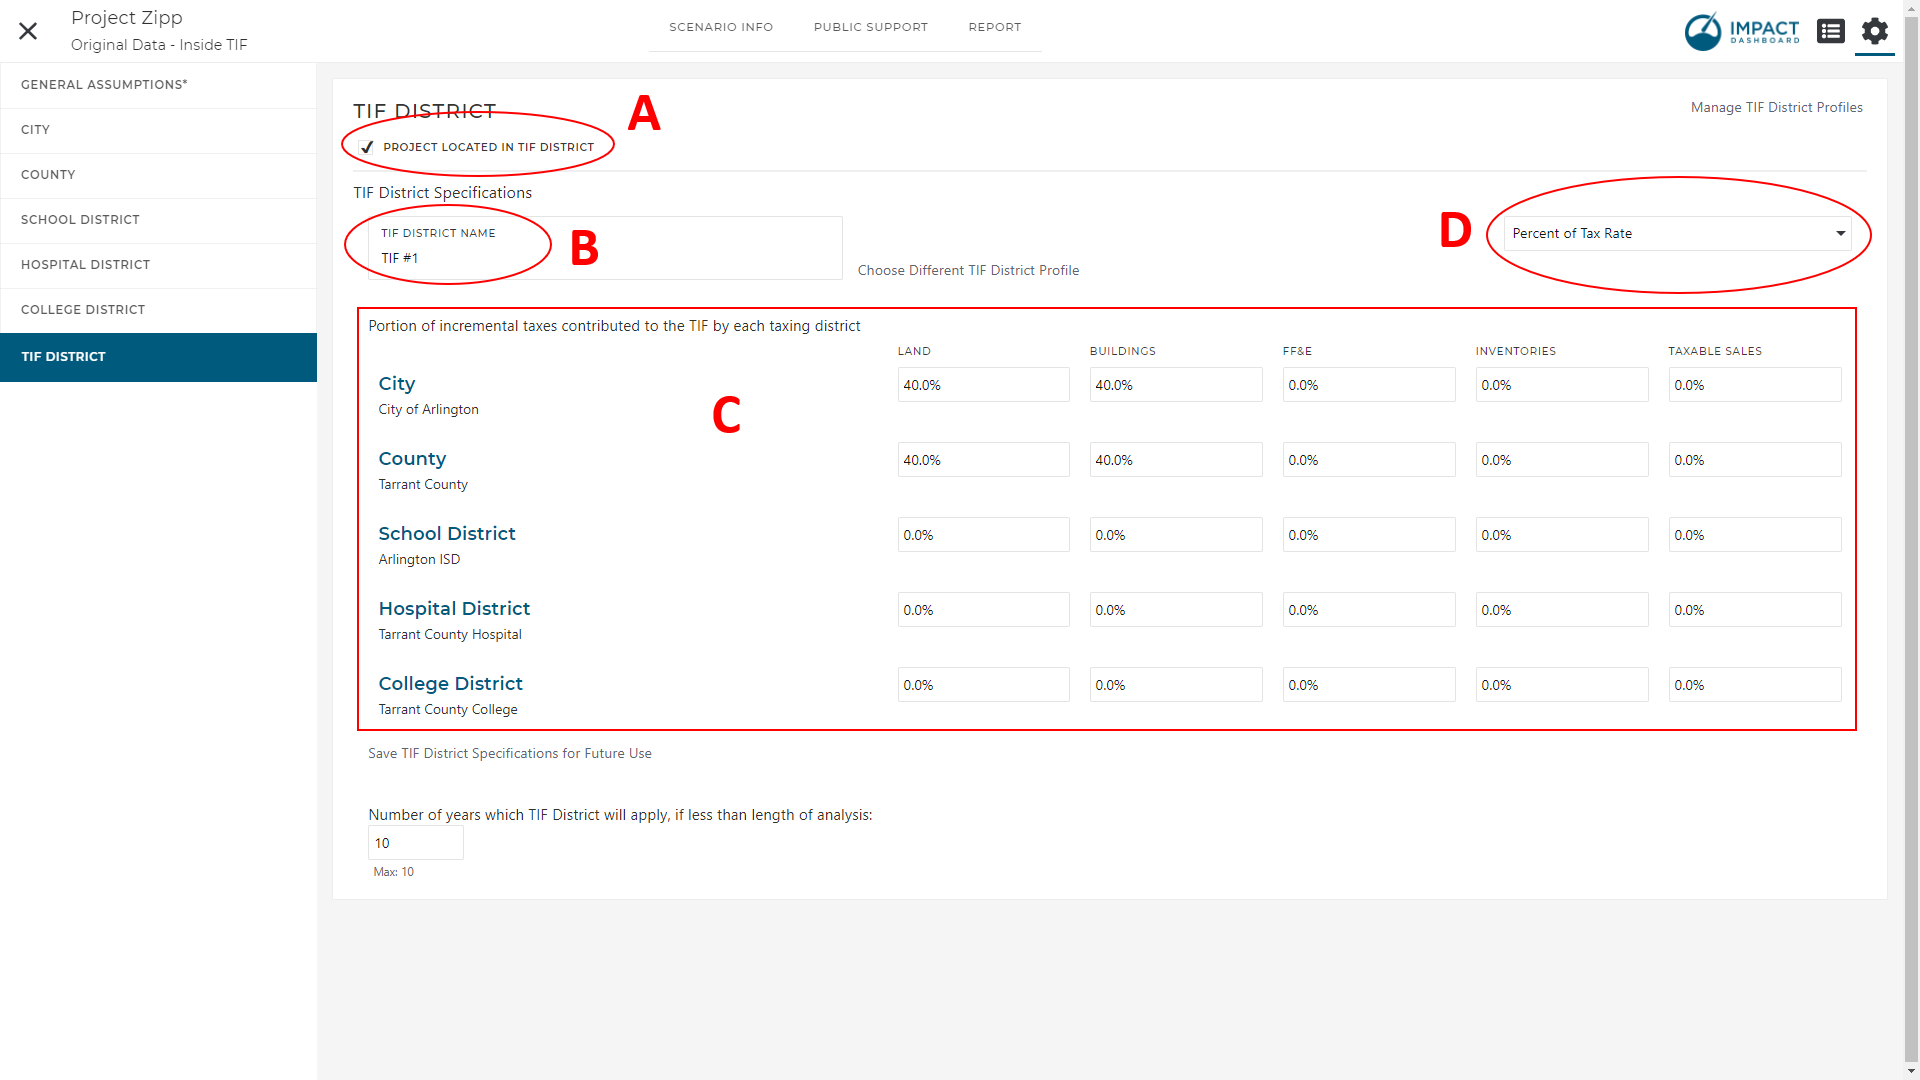
Once you’re in the Scenario Assumptions area, you’ll see a new tab on the far right called “TIF District”. If you select that tab you can click on the box that says “Project Located in TIF District” (“A” in the image below). Now you’ll be able to name the TIF District (labeled “B”) and identify the portion of incremental taxes contributed to the TIF District (labeled “C”). You can specify the portion of taxes as a percent of the total tax rate or as a specific amount. For example, if the City were to contribute ALL of its property taxes on the incremental property to the TIF district, you could put 100% in the city input fields. Some clients may need a little bit more precision. For example, if the tax rate is 5.2 but the city contributes 3.0 of the tax rate to the TIF, you can enter the contribution as the Amount of Tax Rate vs. Percent of Tax Rate (labeled “D”).
3. Save the TIF District specifications for future use in other scenarios.
If you have an existing TIF District that you’d like to save in your system so that you can apply it to other scenarios, you have the ability to save TIF District specifications (labeled “E”). You can manage your TIF District Profiles on the My Account page (labeled “F”). Saved TIF profiles will then be accessible to be applied in any scenario (labeled “G”).

4. View the TIF District revenues in the reports.
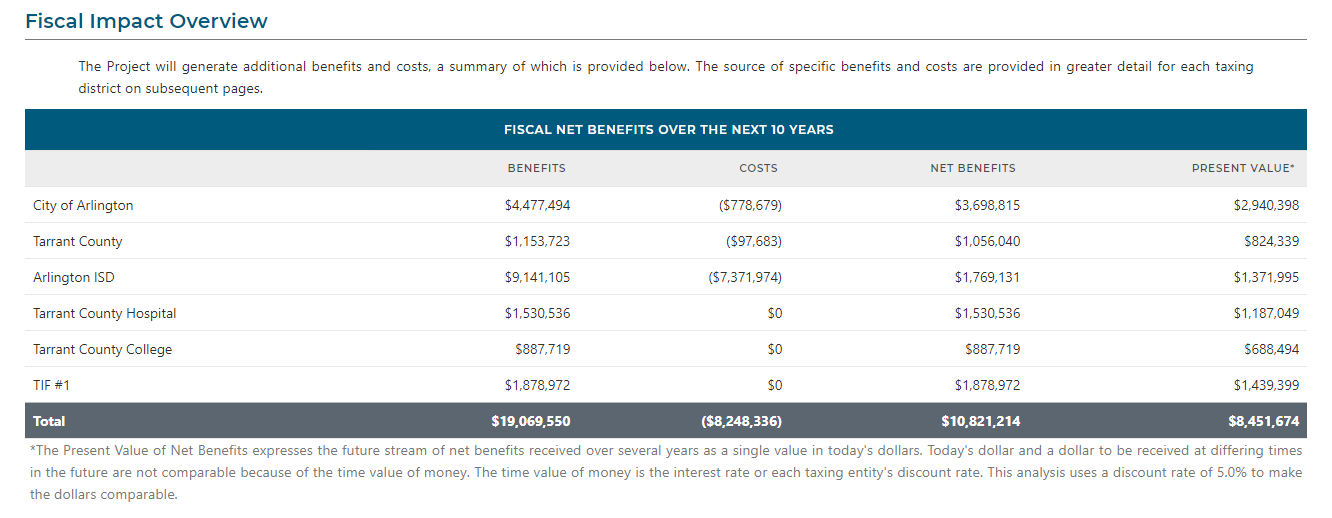
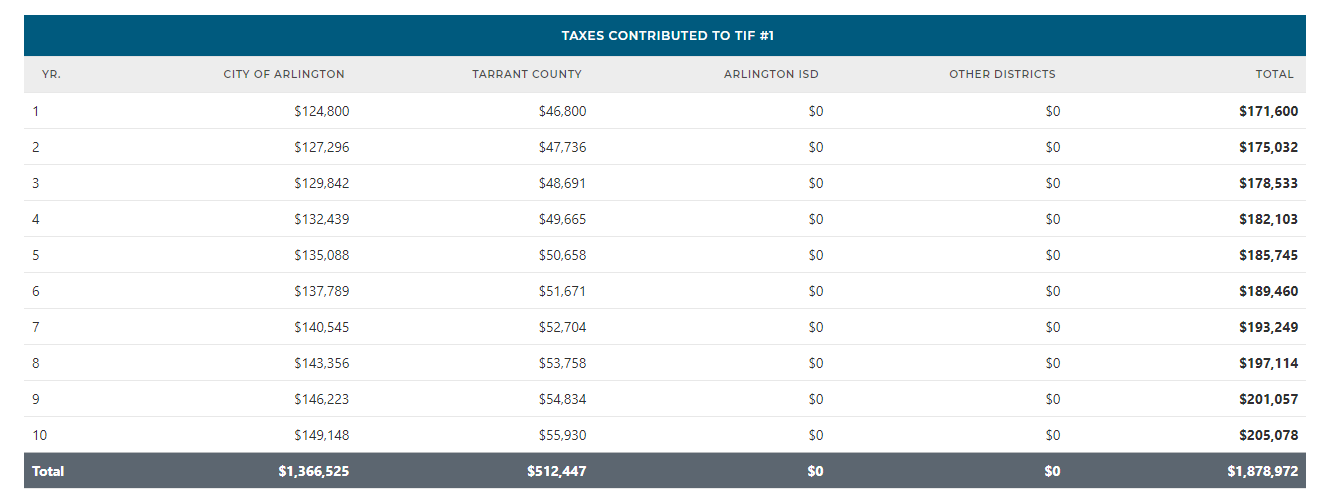
The reports will update to include the effect of these calculations and create a new entity for the TIF District so you can see the total revenue it receives, potentially from multiple entities. We also added a couple extra tables in a newly created Appendix in the Detailed Report. Remember, the other districts that contribute to the TIF District will see reductions in property tax revenue when considering a project in the TIF District.
5. Save the TIF District specifications for future use in other scenarios.
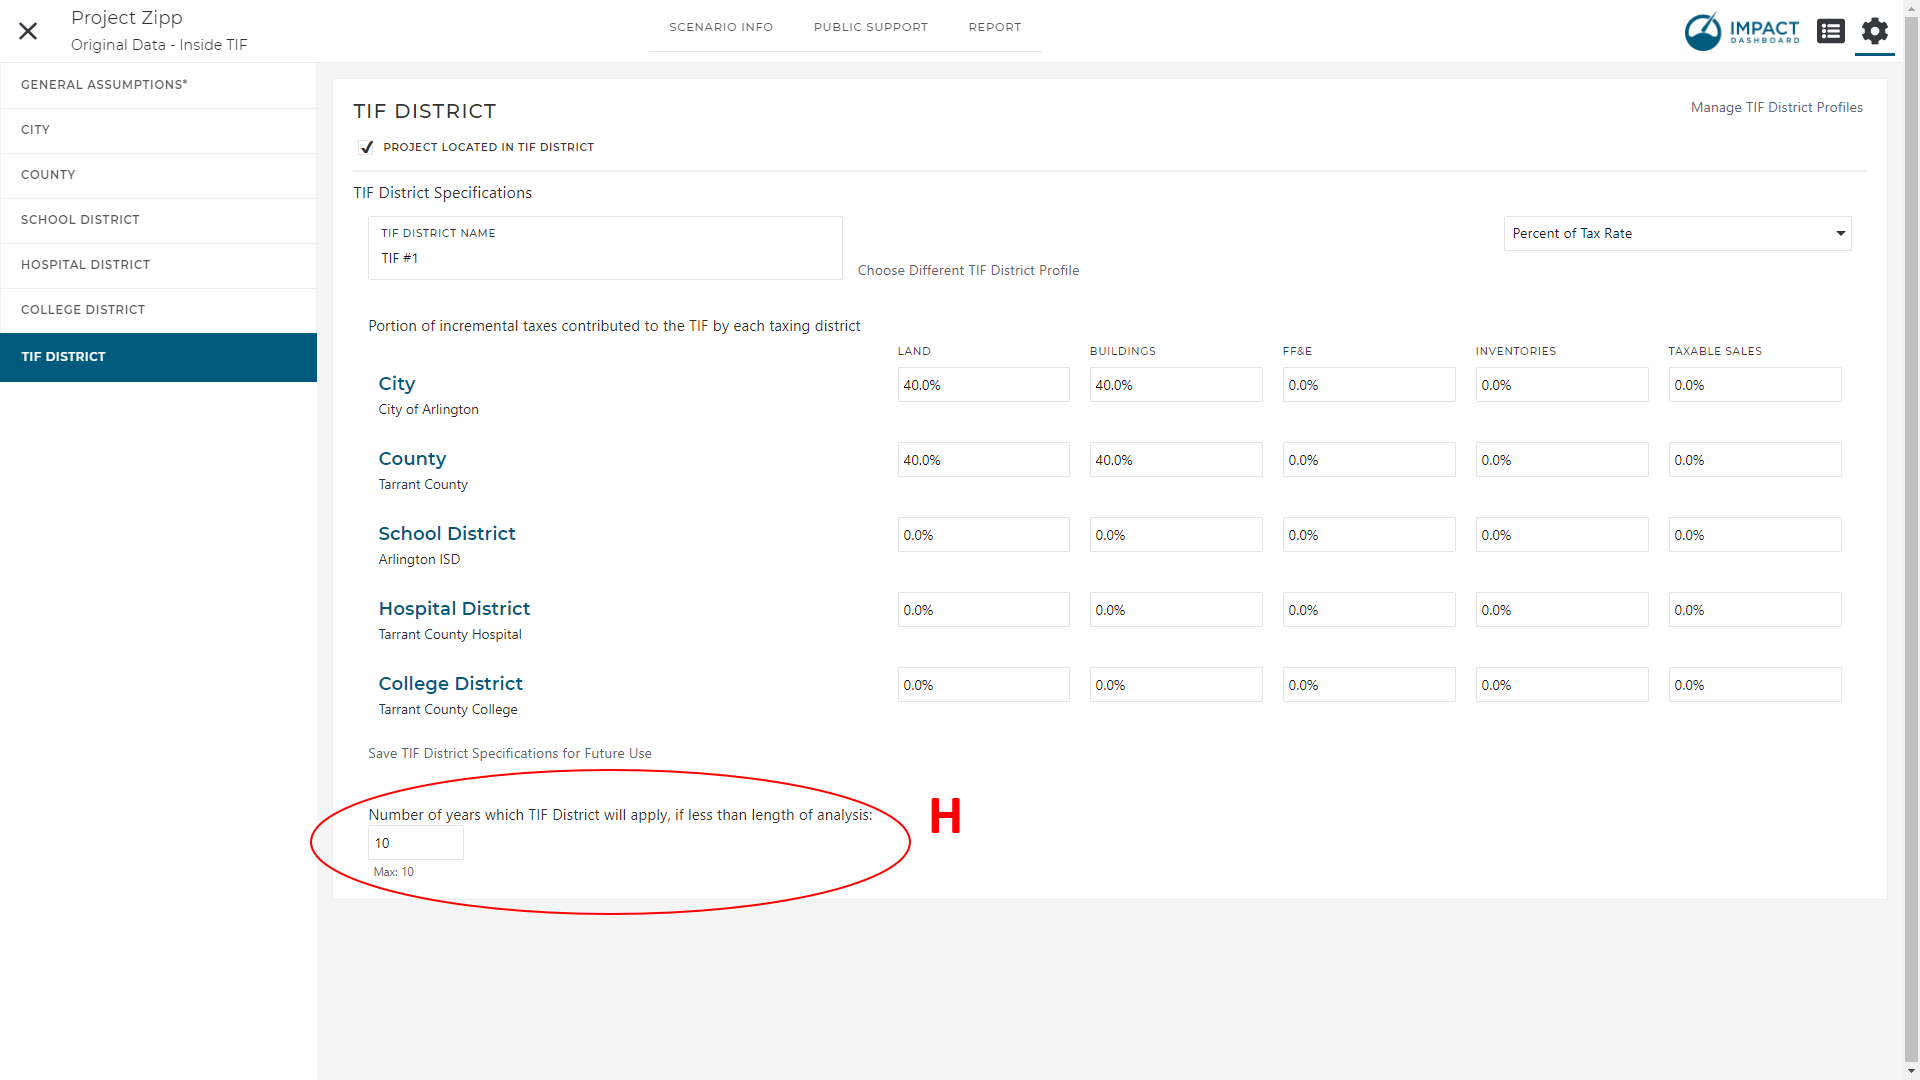
If you have a TIF District that is expiring within the term of the analysis, you can indicate the duration of the TIF District on the Settings/TIF District page. For example, if you are conducting a 10 year analysis but the TIF is scheduled to expire in 5 years, you can specify 5 years in the field marked “Number of years which the TIF District will apply” (labeled “H”). This will apply the TIF calculations for the first 5 years and then calculate property tax as normal for the remaining 5 years. Just a reminder, that if you need to change the length of the overall analysis from 10 years to say 15 years, you can do that on the General Assumptions tab of the Scenario Assumptions, look for the input marked “Scenario Length (Years)” on the lower left side of the page.
Check out the video below to see a walk-through of the new features!
For more assistance with the new features, please contact us!