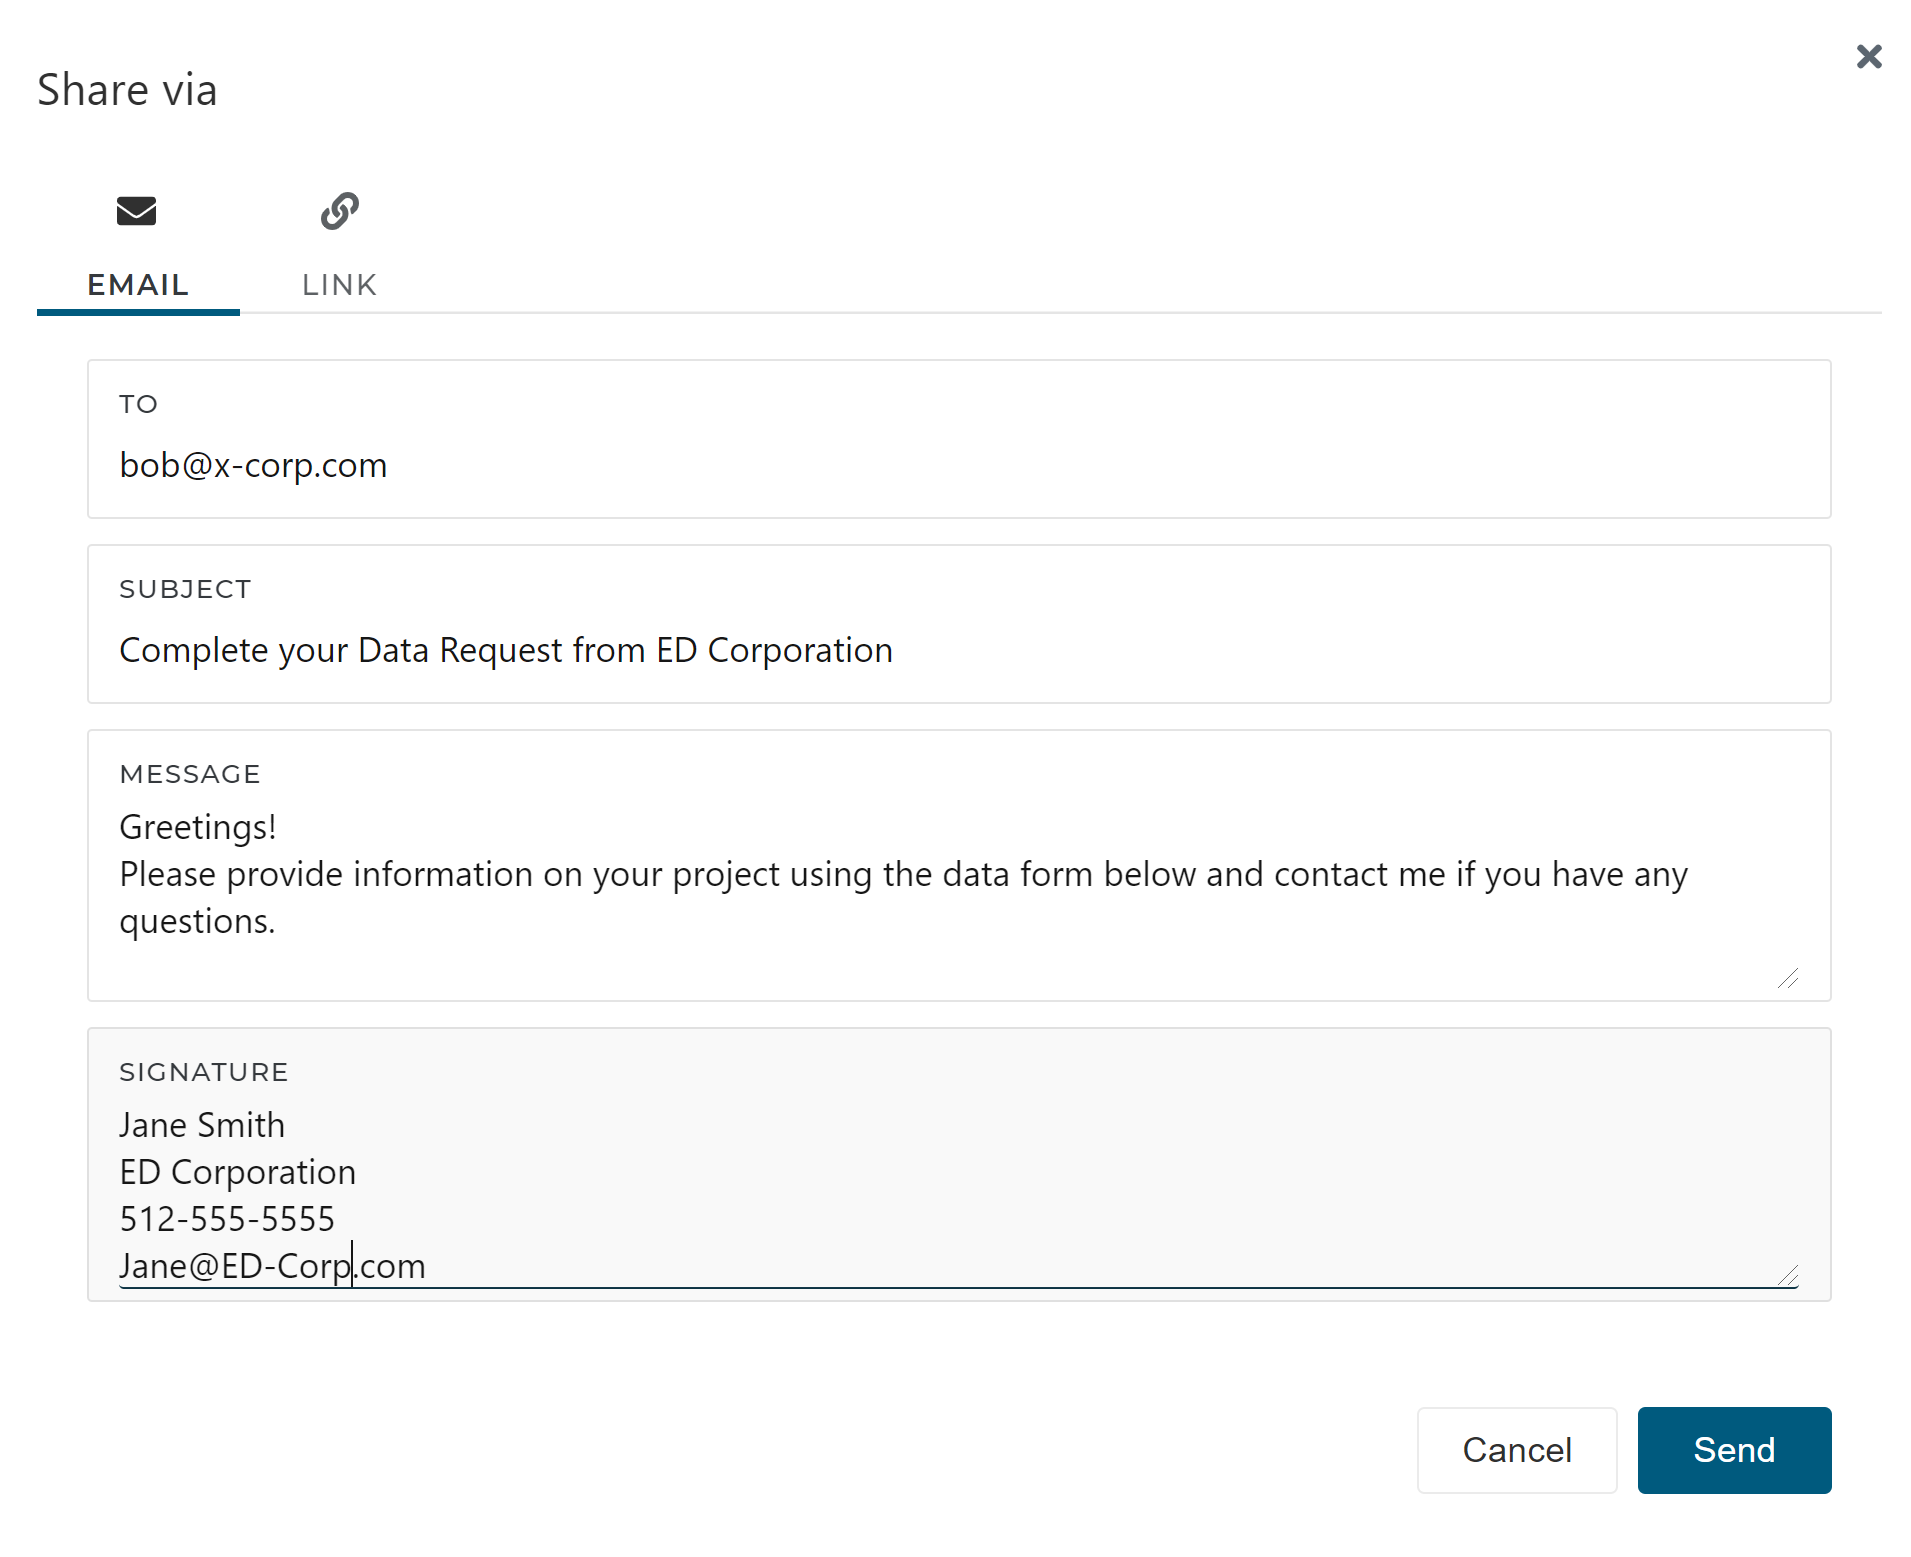
Send a request via email from the app OR post a link to your questionnaire on your EDO’s website.
Collect details on prospective projects electronically with the intuitive Impact DashBoard Data Form Wizard.
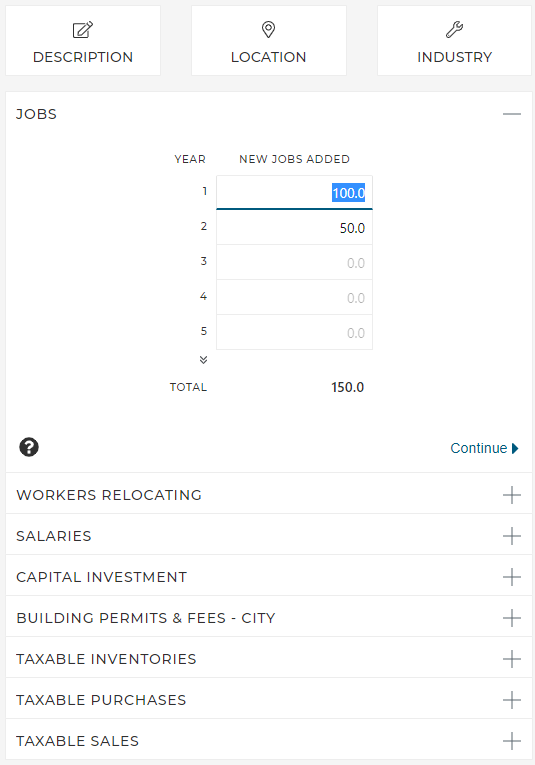
Enter Economic Development Project Data Directly
Open up a new scenario and get things started yourself!
If you have the details on a prospective project – from a phone call or from an RFI, you can skip the electronic data request form and enter the data directly
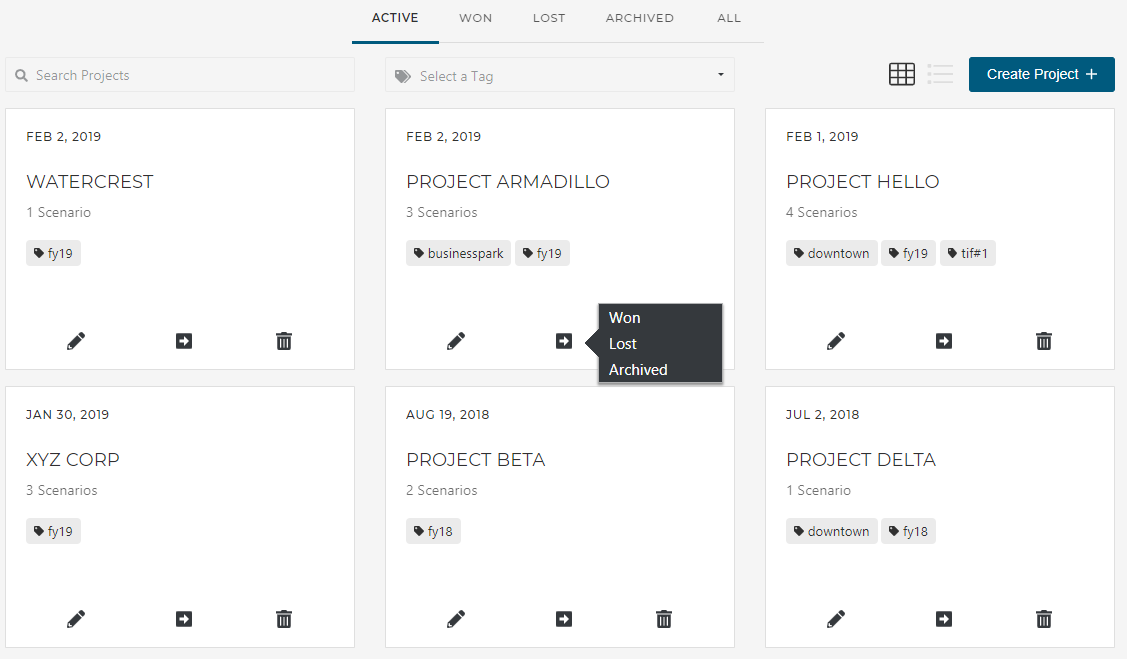
Keep All This Data Organized
Put that project in the win column!
Organize projects into groups and tag similar projects so you can keep things categorized.
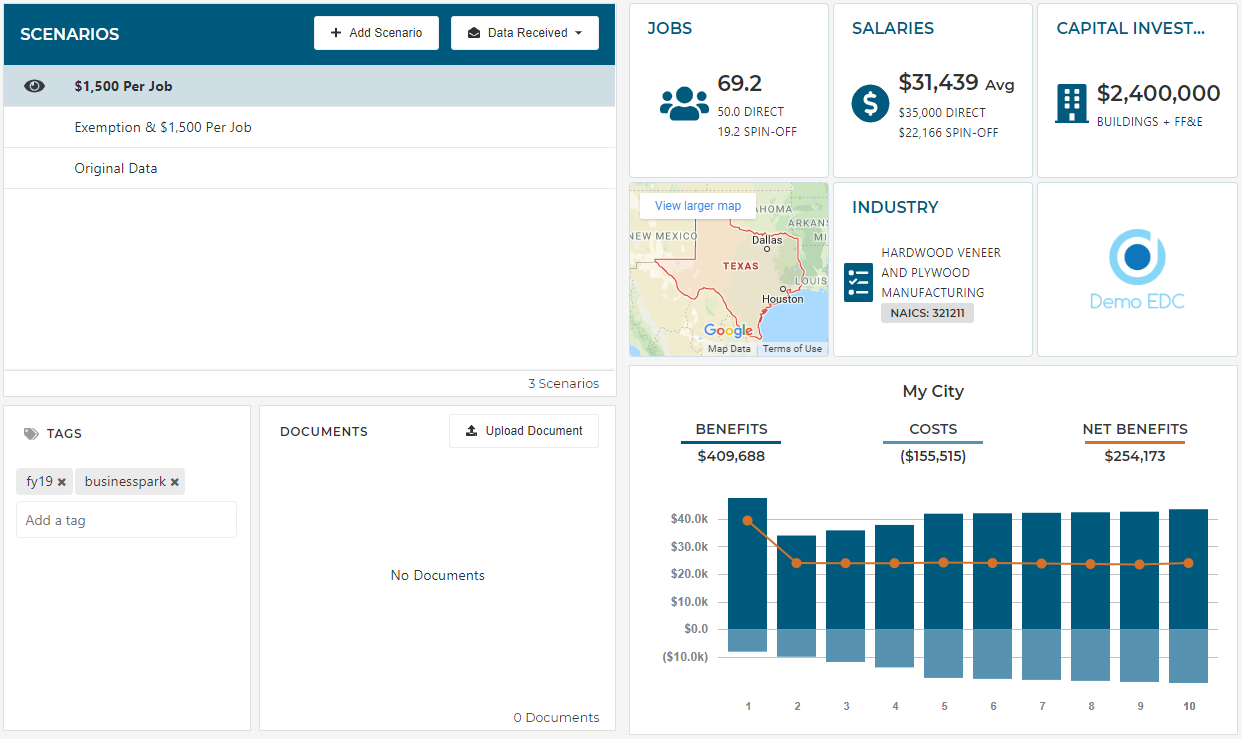
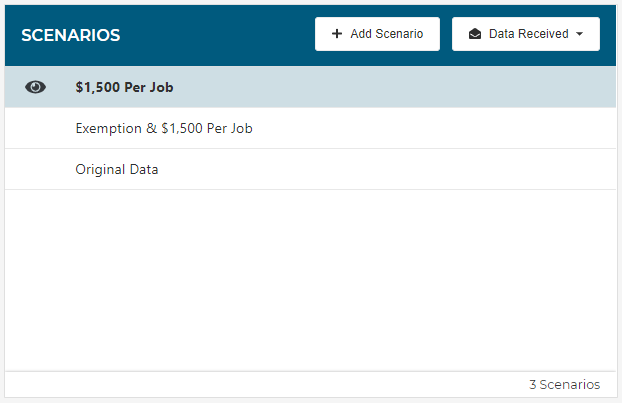
Project Control Center
The landing page for the Project.
See a list of the all of the impact scenarios you’ve evaluated, see a summary of the results from a selected scenario, and add tags or upload documents.
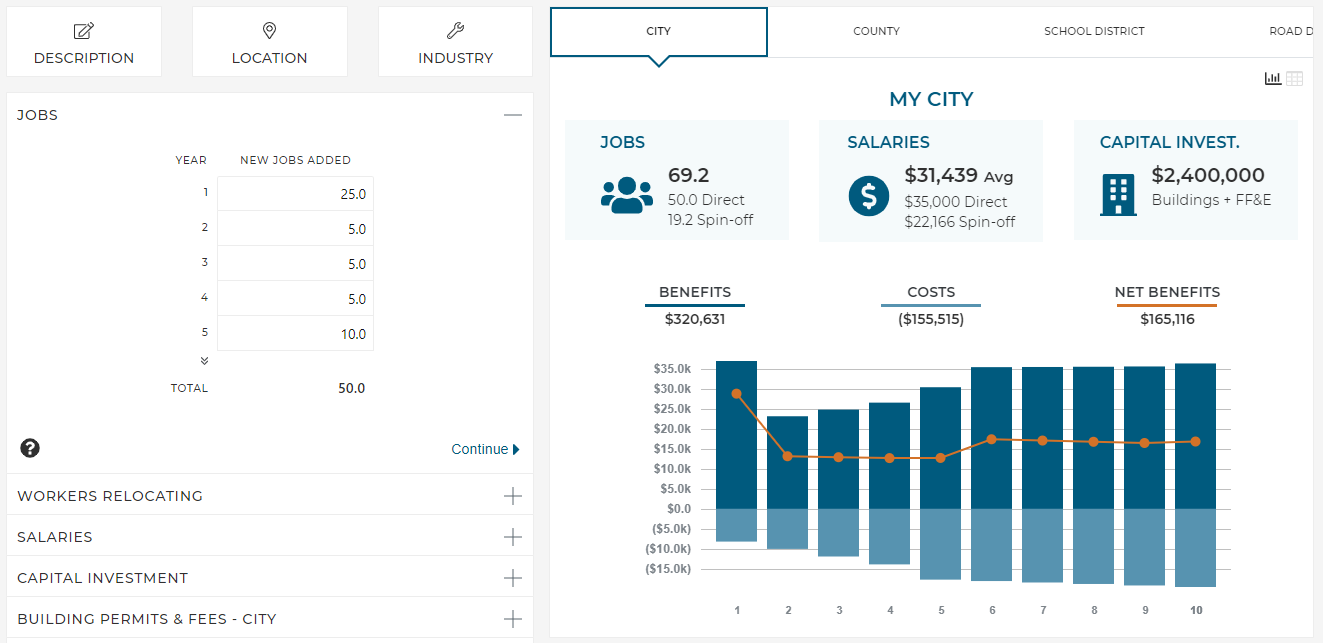
Impact Analysis
Results in real time.
Adjust inputs and see the calculations update immediately. Review the spin-off jobs and tax impacts all from the DashBoard.
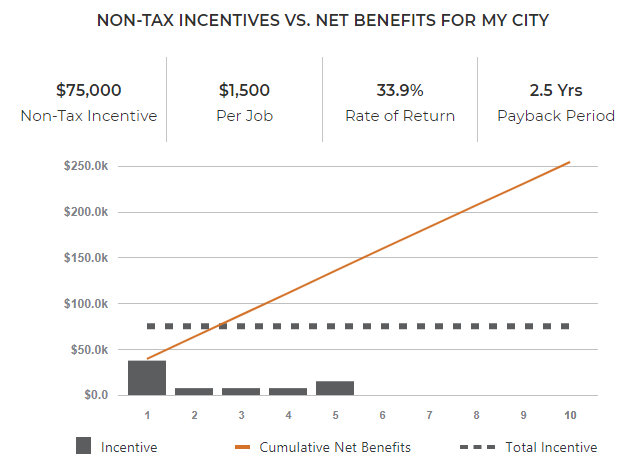
Incentive Analysis
Get your ROI.
Model common incentives like tax abatements/rebates, job creation grants, paid-for infrastructure and get your ROI. Show concisely what you’re giving up and what you’re getting.
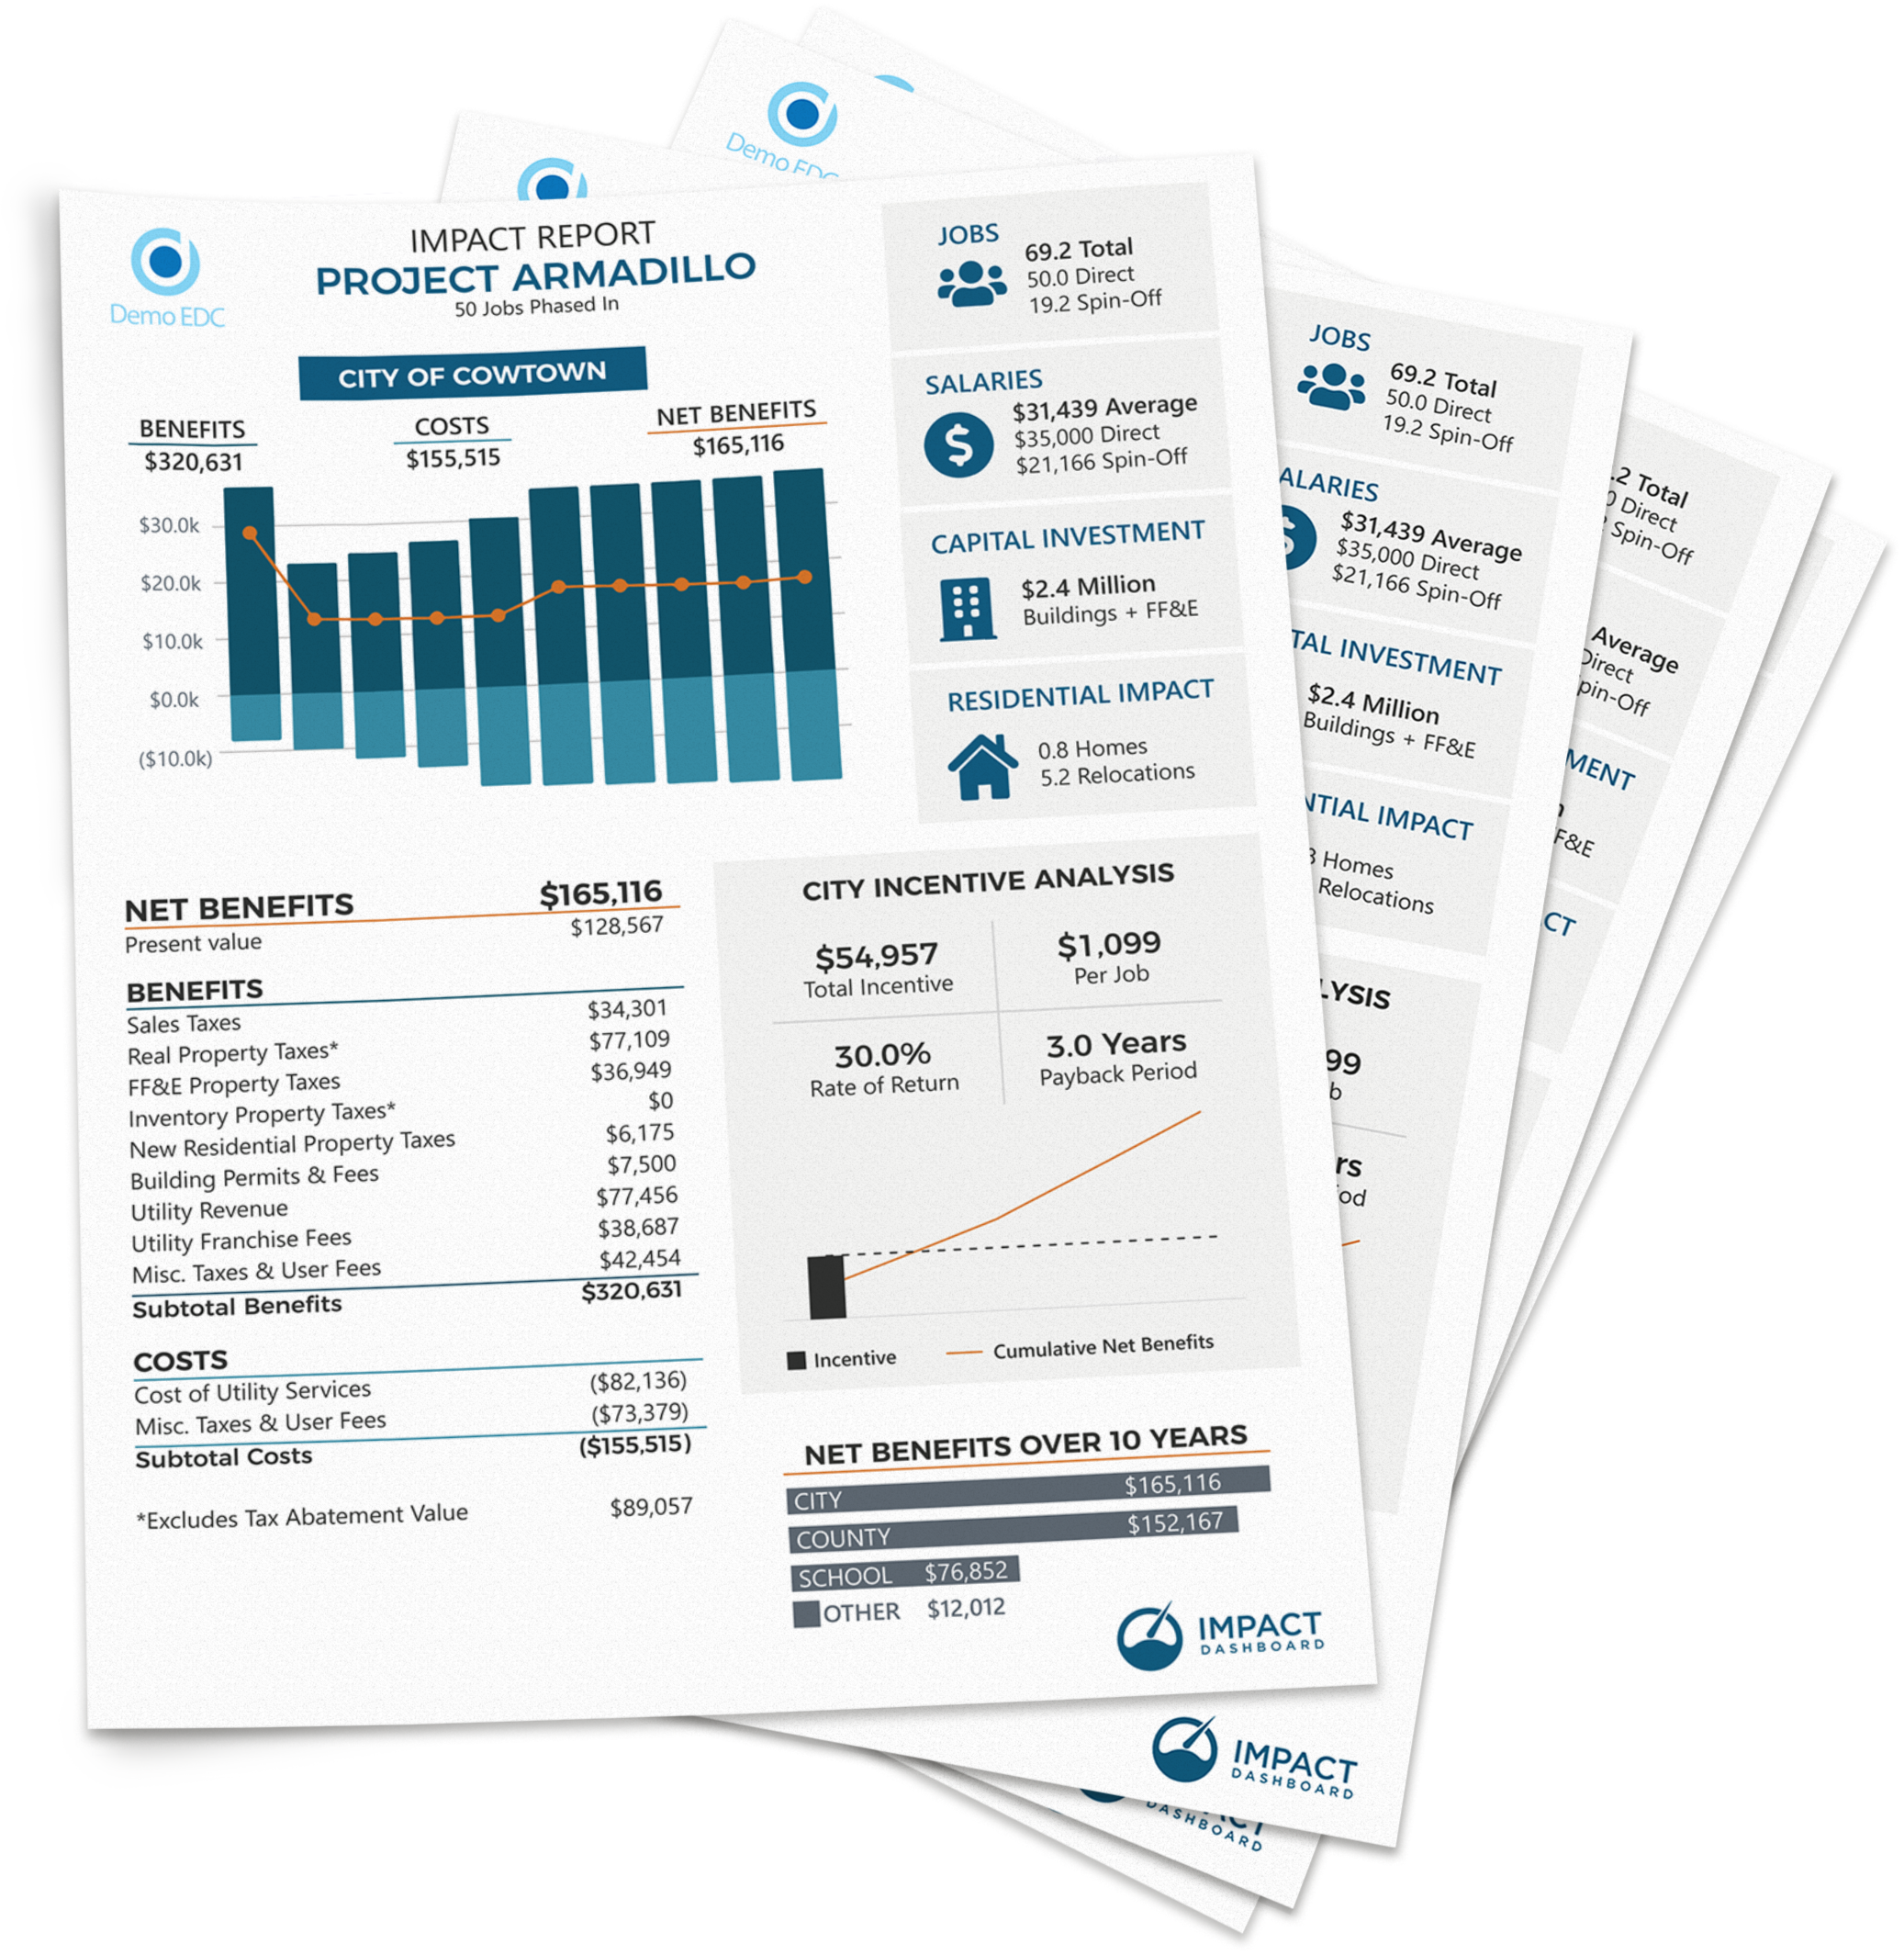
Reporting Options
Reports at the ready.
If you need to dive deep into the results, save or print the detailed report. For shorter attention spans, use the one-page infographic to tell your story.