
The latest feature releases for Impact DashBoard include several new incentive modeling options as well as a new summary report. Let’s dig in.
New Community Summary Report
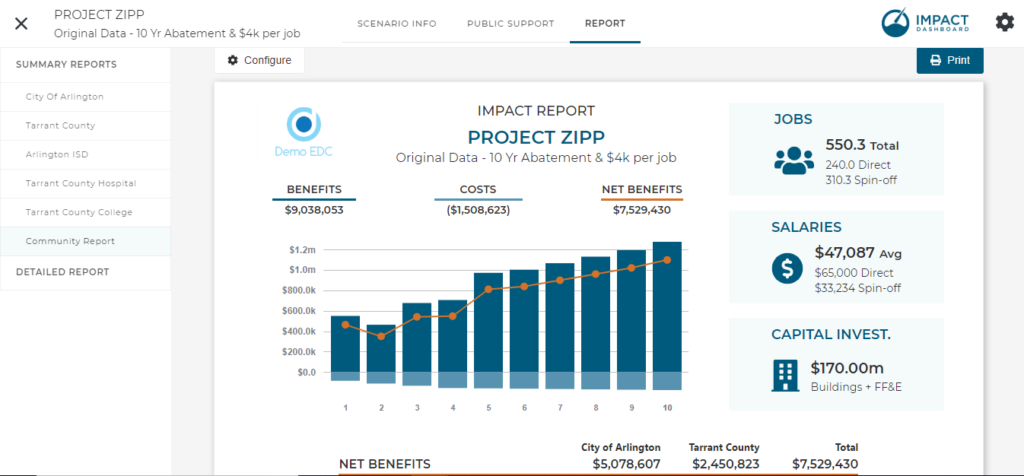
The new Community Report option allows you to create a custom one-page infographic summary report for any combination of districts included in your analysis. Up to this point, the Impact DashBoard Summary reports included information for just one tax entity. Now, this new Community Report feature allows you to summarize results for the city AND the county on one page. The report can be configured in a number of different ways so you can aggregate the impact for however many districts you choose. Go wild – include all of the districts in your scenario in your new Community Report.
Sales Tax Rebates on Capital Investment-Related Expenditures
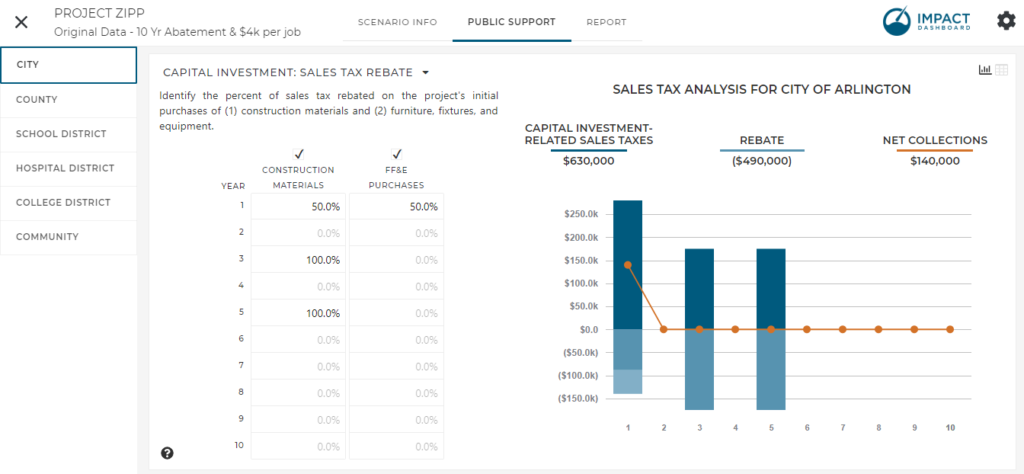
Sometimes ED incentives include exempting the sales tax paid on construction materials or purchases of equipment or machinery. Now Impact DashBoard can help you model these incentives. Based on the capital investments in “Buildings and Other Real Property Improvements” and “Furniture, Fixtures, and Equipment (FFE), you can exempt all or a portion of the sales taxes estimated in the scenario.
Construction Materials
Impact DashBoard includes several parameters to determine the construction material sales tax for a scenario. First, we assume a certain portion of the Building and Other Real Improvement costs is spent on construction materials (50% is a typical default). Next, assuming the district in question collects a local sales tax, we will assume a certain portion of those construction materials will be purchased in district and will be subject to the local sales tax. Finally, the new sales tax rebate section accepts an input for what percent of the construction materials sales tax you will rebate.
FFE
Rebates on sales taxes for FFE purchases rely on several parameters as well including the local sales tax rate, percent to be rebated, and the portion of the FFE purchased in district and subject to the local sales tax.
Community Incentive Option
As Impact DashBoard users know, they can model an incentive from an individual district and determine the ROI and payback period using the individual tax district’s net benefits. In other words if the city is going to offer an ED grant of $100k, Impact DashBoard compares that $100k investment to the return the city receives in the form of net additional revenues from the project. An exciting new feature just added to Impact DashBoard takes this concept one step further. Imagine if an incentive were provided on behalf of the entire community – city, county, school district, and all other local jurisdictions – and you want to compare that investment against the net additional revenues to all of the affected districts. That’s exactly what we’ve created with a Community Non-Tax Incentive. In fact, you can compare an incentive against the combined net benefits of any combination of jurisdictions in the model. Perhaps you just want to compare an incentive provided jointly by the city and county, now you can do that.
How it Works
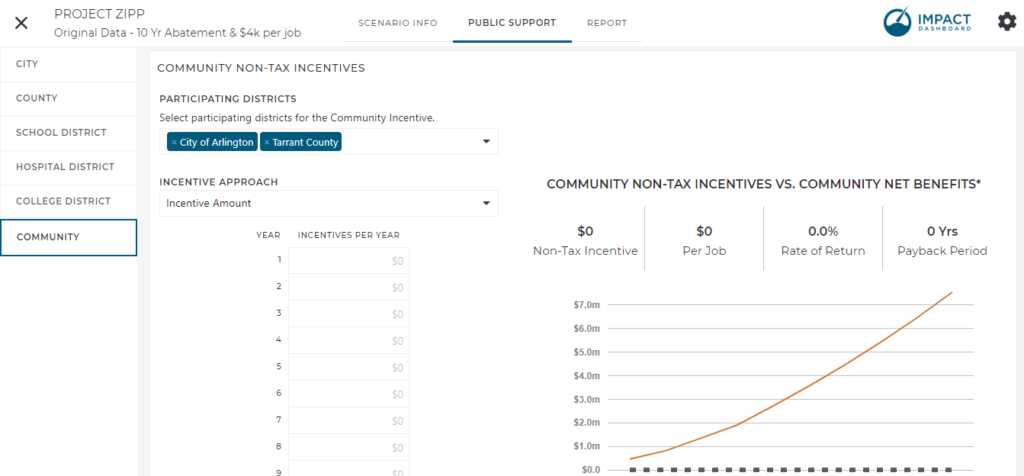
You’ll find the new Community Non-Tax Incentive feature on the Public Support page on the Community tab.
You can choose which districts will participate in the Community Non-Tax Incentive.
You enter the incentive amount and see the ROI.
Next, you can allocate the entire incentive amount to the participating districts. For example, you might choose “Equal Share” and each district will be allocated an equal share of the total incentive. You might choose “Proportional to Net Benefits” and each district will be allocated a portion of the incentive equal to its contribution to the combined Net Benefits for participating districts. You may also choose “Custom” and enter individual percentages that add up to 100%.
Based on your allocation, the ROI will be calculated for the individual districts and over all.
Finally, all of the calculations will be incorporated into the reports – including the brand new Community Summary Report.
Calendar Years Option
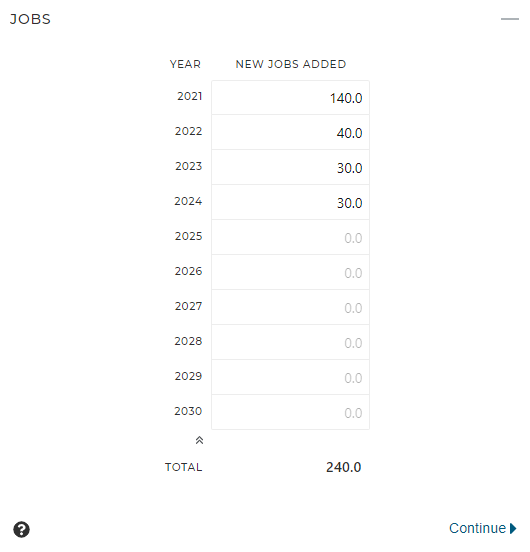
At your request, we can give you the option of showing Calendar Years on the inputs to your model to help you align the investment schedule with reality. The default is still Year 1 – Year 2 – Year 3 but let us know if you’d like to have calendar Years option enabled for your account.