Impact DashBoard Knowledge Base
My Account
The My Account area can be accessed on the left side navigation panel. My Account consists of three pages to configure and customize your overall Impact DashBoard account.
General
The General page allows for several basic actions related to your account and is where you can find your individual User Guide and other template documents.
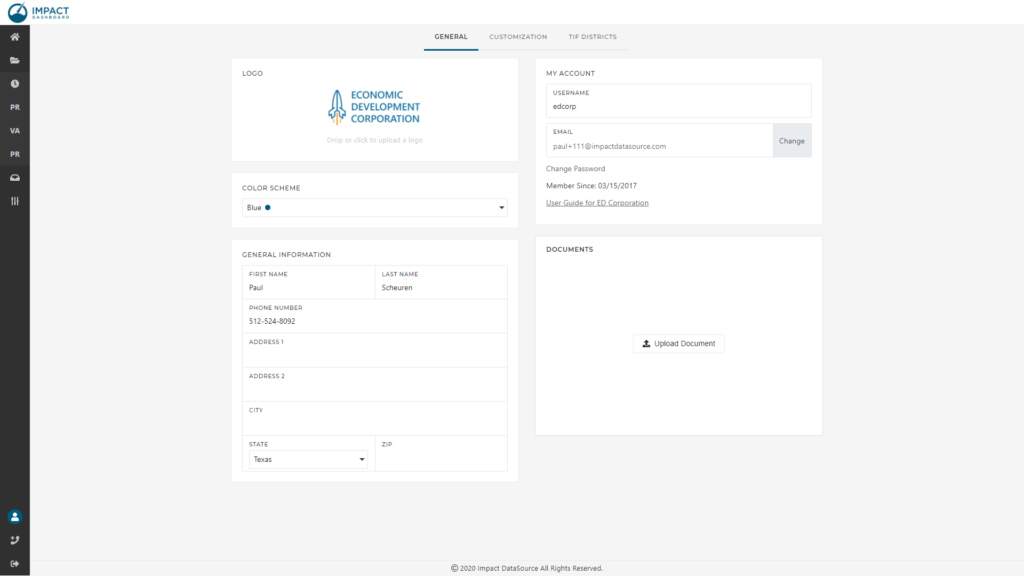
Upload or Change Logo
You can upload or change the logo associated with your account. The organization’s logo appears throughout the Impact DashBoard environment. Most notably the logo appears on the Reports and on Data Form Wizard.
Choose a Color Scheme
You can choose from one of three cohesively-designed color scheme options to match your organization’s branding.
- Blue
- Green
- Red
Edit General Information & Username
You can edit the general contact information and the organization’s username.
Change Email Address
For security purposes, you cannot directly change the email address associated with the account. Accordingly, you can make a request to change the email address contact associated with the Impact DashBoard account and an Admin will complete the change.
User Guide & Documents
The General page of the My Account area also includes links to the organization’s User Guide and other template documents Impact DataSource may have posted for you.
Customization
The Customization page of the My Account area allows you to create or edit user-defined Project categories for the following items:
- Project Types
- Industries
- Square Footage Types
- Project Tags

You can rename a specific item by hovering over the line and clicking Rename (pencil icon). You can delete a specific item by hovering over the line and clicking Delete (trash icon). You can add new items by clicking the New button for the specific category.
The number in parentheses after each Project Type, Industry, or Project Tags indicates how many of your Projects have been assigned the given term.
TIF Districts
The TIF Districts page of the My Account area shows a list of saved TIF District Profiles. You can incorporate a TIF District into an analysis to capture all or a portion of the incremental tax revenues generated from a Project’s property or sales. The TIF District will be added to the model as a quasi-Taxing District and the Detailed Report will incorporate information about revenues directed to the TIF District from existing Taxing Districts as well as the revenues received by the TIF District.
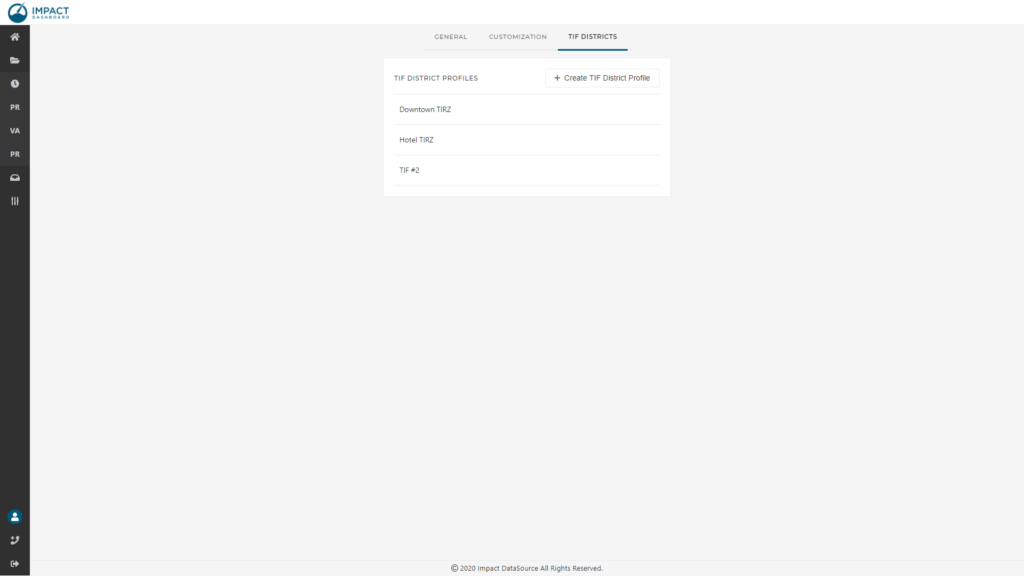
To create a new TIF District profile, click on the Create TIF District Profile, name the profile, and complete the table shown on the screen. Identify the portion of incremental taxes contributed to the TIF District. You can specify the portion of taxes as a percent of the total tax rate or as a specific amount. For example, if the City were to contribute ALL of its property taxes on the incremental property to the TIF district, you could put 100% in the city input fields. Some clients may need a little bit more precision. For example, if the tax rate is 5.2 but the city contributes 3.0 of the tax rate to the TIF, you can enter the contribution as the Amount of Tax Rate vs. Percent of Tax Rate.
You can view a TIF District Profile by clicking on the name to reveal the specifications table. You can rename a TIF District Profile by clicking on the profile and changing the TIF District Name in the specifications table. You can delete a TIF District Profile by hovering over the line and clicking Delete (trash icon). You can copy a TIF District Profile by hovering over the line and clicking Copy (copy icon).