Impact DashBoard Knowledge Base
Public Support
The Public Support page includes tabs for each Taxing District so that you can model a wide range of incentives for each Taxing District. Impact DashBoard allows for Property Tax, Sales Tax, Hotel Tax
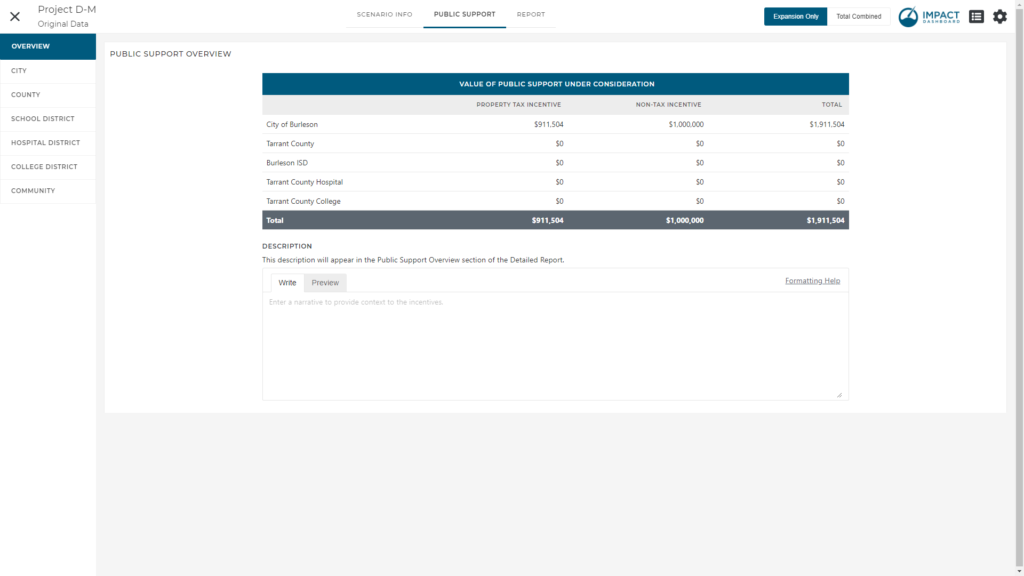
An Overview tab will appear on the left side tab menu of Public Support if any incentives are modeled for the Scenario. This section will be hidden if the Scenario does not incorporate any incentives. The Overview section includes an option Public Support Description field where you can explain the incentives modeled for the Project. The Public Support Description will be shown in the Public Support Overview section of the Detailed Report
Property Tax Incentive
A Property Tax Incentive can be modeled on the Public Support page after navigating to the appropriate Taxing District that will provide the incentive. Impact DashBoard has incorporated flexible terminology around a Property Tax Abatement, Exemption, Rebate, or Reimbursement. The analysis and calculations are identical across the four options but the flexible terminology is intendent to help convey the community’s intentions. The remainder of this section will refer to a Property Tax Abatement however the description applies identically to the other terminologies.
To apply a property tax abatement, simply enter the abatement schedule – the percent of taxes to be abated – in the table under Property Tax Abatement. You can enter abatement schedules that vary over time and by type of property. For example, the abatement schedule on the building could decline from 100% to 10% from Year 1 to Year 10 while the abatement for FF&E is 50% for 5 years.
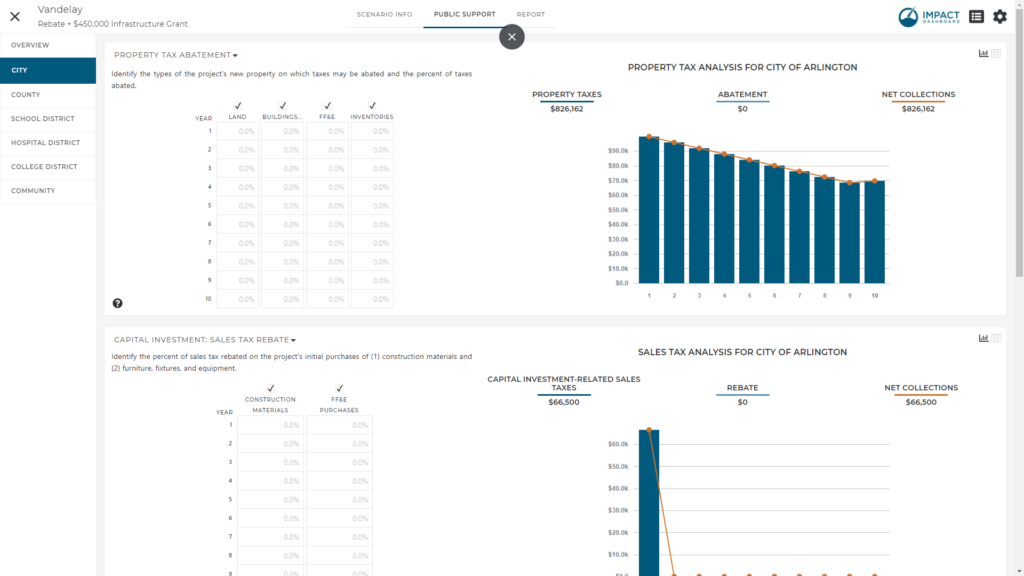
The Property Tax Analysis on the right side of the Public Support page illustrates the effect of the Property Tax Abatement. Property Taxes represent the total property taxes collected over the period of the analysis by the Taxing District based on the District’s portion of the local property tax rate and the new property to be added by the company. The Abatement shows the value of the property tax abatement over the specified period. The Net Collections presents the net property tax collections after accounting for the abatement.
You can click on the table icon to see a table view of the Property Tax Analysis.
If you have not entered any capital investments or taxable inventories on the Scenario Info page, you will not see this section on the Public Support page. Additionally, this section will be hidden if the Taxing District of interest does not collect property tax.
Sales Tax Incentive: Capital Investment
A Sales Tax Incentive for Capital Investment purchases can be modeled on the Public Support page after navigating to the appropriate Taxing District that will provide the incentive. Impact DashBoard has incorporated flexible terminology around a Sales Tax Abatement, Exemption, Rebate, or Reimbursement. The analysis and calculations are identical across the four options but the flexible terminology is intendent to help convey the community’s intentions. The remainder of this section will refer to a Sales Tax Rebate however the description applies identically to the other terminologies.
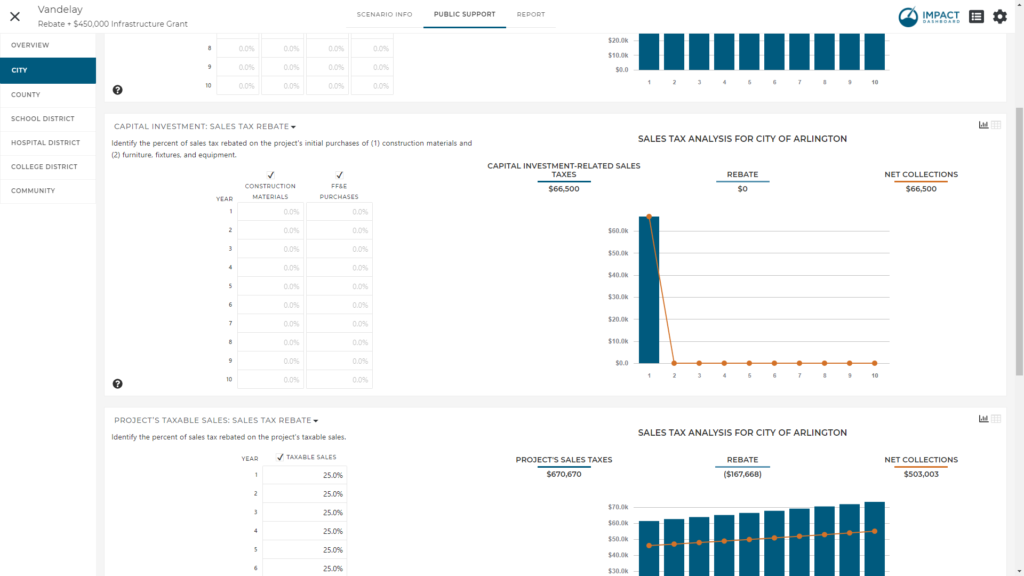
To apply a sales tax rebate, simply enter the rebate schedule – the percent of taxes to be rebated in the table under Capital Investment: Sales Tax Rebate. You can enter rebate schedules that vary over time and by type of capital investment purchase (Construction Materials vs. FF&E Purchases). For example, the rebate schedule on the construction materials could be 100% for all relevant years while the rebate for sales taxes on FF&E purchases could be 50%.
Note that the Rebate Schedule is only required to correspond to years the project will generate construction materials sales tax or FF&E sales tax.
The Sales Tax Analysis on the right side of the Public Support page illustrates the effect of the Sales Tax Rebate on Capital Investment Purchases. Capital Investment-Related Sales Taxes represent the total sales taxes collected over the period of the analysis by the Taxing District on construction materials and FF&E purchases and the local sales tax rate. The Rebate shows the value of the sales tax rebate over the specified period. The Net Collections presents the net sales tax collections for capital investment-related purchases after accounting for the rebate.
Remember: The value of Taxable Construction Materials Purchases that will be subject to sales tax is district dependent. Impact DashBoard assumes a portion of the Building and Other Real Property Improvements capital investment amount will be spent on Materials and the remaining portion will be spent on Labor. By default, these assumptions are usually set to 50% for materials and 50% for Labor.
Additionally, each Taxing District has an assumption controlling how much of these Materials will be subject to sales tax by the Taxing District. By default, it is very often assumed to be less than 100% so as not to overestimate the construction materials sales tax. You can adjust this assumption in Settings > Taxing District > Sales Tax section > “Percent of Construction Materials Purchased in the Taxing District”.
Similarly, the value of Taxable FF&E Purchases that will be subject to sales tax is district dependent. The capital investment for FF&E is used as the basis for Taxable FF&E Purchases are calculated by multiplying the capital investment for FF&E by the percent of FF&E that will be purchased in the Taxing District. You can adjust this assumption in Settings > Taxing District > Sales Tax section > “Percent of FFE That Will Be Purchased in District and Subject to Local Sales Tax”.
You can click on the table icon to see a table view of the Sales Tax Analysis.
If you have not entered any Building or FF&E capital investments on the Scenario Info page, you will not see this section on the Public Support page. Additionally, this section will be hidden if the Taxing District of interest does not collect a local sales tax.
Sales Tax Incentive: Taxable Sales
A Sales Tax Incentive for the Project’s Taxable Sales can be modeled on the Public Support page after navigating to the appropriate Taxing District that will provide the incentive. Impact DashBoard has incorporated flexible terminology around a Sales Tax Abatement, Exemption, Rebate, or Reimbursement. The analysis and calculations are identical across the four options but the flexible terminology is intendent to help convey the community’s intentions. The remainder of this section will refer to a Sales Tax Rebate however the description applies identically to the other terminologies.
To apply a sales tax rebate, simply enter the rebate schedule – the percent of taxes to be rebated in the table under Project’s Taxable Sales: Sales Tax Rebate. You can enter a rebate schedule that varies over time. For example, the rebate schedule could be 100% for 5 years and then 50% for 5 years.
The Sales Tax Analysis on the right side of the Public Support page illustrates the effect of the Sales Tax Rebate on the Project’s Taxable Sales. Project’s Sales Taxes represent the total sales taxes collected over the period of the analysis by the Taxing District on the Project’s taxable sales after applying the local sales tax rate. The Rebate shows the value of the sales tax rebate over the specified period. The Net Collections presents the net sales tax collections on the Project’s taxable sales after accounting for the rebate.
You can click on the table icon to see a table view of the Sales Tax Analysis.
If you have not entered any “Taxable Sales” on the Scenario Info page, you will not see this section on the Public Support page. Additionally, this section will be hidden if the Taxing District of interest does not collect a local sales tax.
Hotel Tax Incentive: Hotel Taxes
A Hotel Tax Incentive for the Project’s Hotel Lodging Spending can be modeled on the Public Support page after navigating to the appropriate Taxing District that will provide the incentive. Impact DashBoard has incorporated flexible terminology around a Hotel Tax Abatement, Exemption, Rebate, or Reimbursement. The analysis and calculations are identical across the four options but the flexible terminology is intendent to help convey the community’s intentions. The remainder of this section will refer to a Hotel Tax Rebate however the description applies identically to the other terminologies.
To apply a hotel tax rebate, simply enter the rebate schedule – the percent of taxes to be rebated in the table under Hotel Taxes. You can enter a rebate schedule that varies over time. For example, the rebate schedule could be 100% for 5 years and then 50% for 5 years.
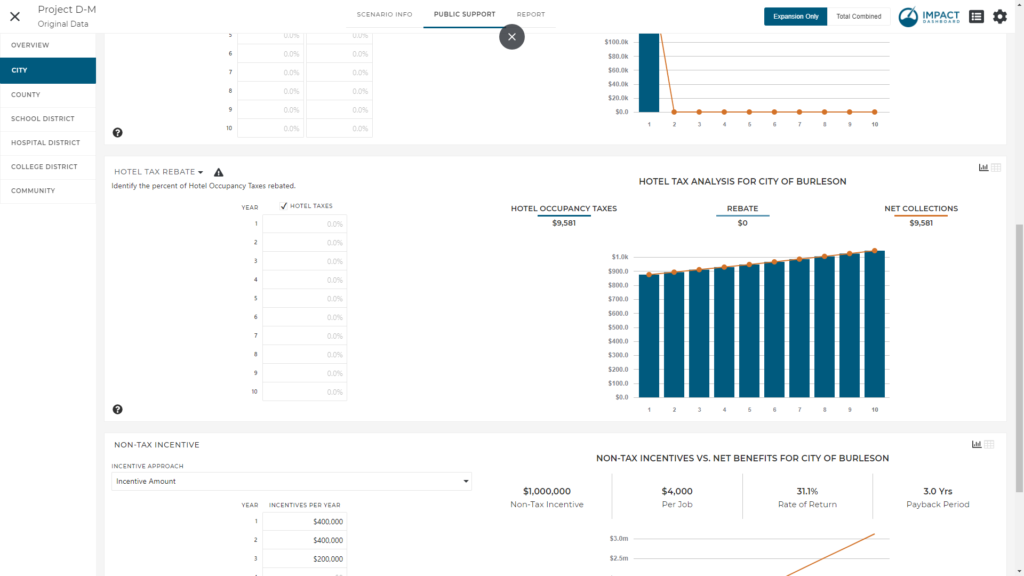
The Hotel Tax Analysis on the right side of the Public Support page illustrates the effect of the Hotel Tax Rebate on the hotel tax collections. Hotel Taxes represent the total hotel taxes collected over the period of the analysis by the Taxing District on the Project’s hotel lodging spending after applying the local hotel tax rate. The Rebate shows the value of the hotel tax rebate over the specified period. The Net Collections presents the net hotel tax collections on the Project’s hotel lodging spending after accounting for the rebate.
You can click on the table icon to see a table view of the Hotel Tax Analysis.
If you have not entered “Hotel Nights” or a “Hotel Daily Rate” on the Scenario Info page, you will not see this section on the Public Support page. Additionally, this section will be hidden if the Taxing District of interest does not collect a local hotel tax.
Non-Tax Incentive
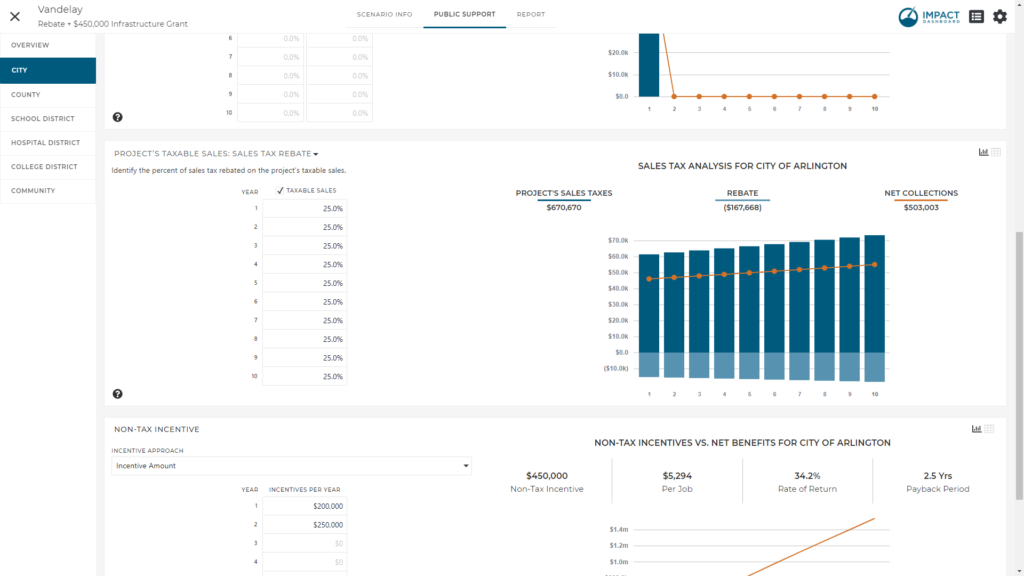
The Non-Tax Incentive is generic term for any additional cash or near cash incentive you would like to evaluate. Examples of Non-Tax Incentives could be a job creation grant, an infrastructure grant, the value of waived fees, the value of free or discounted land, or any other incentive that you can value in dollar terms.
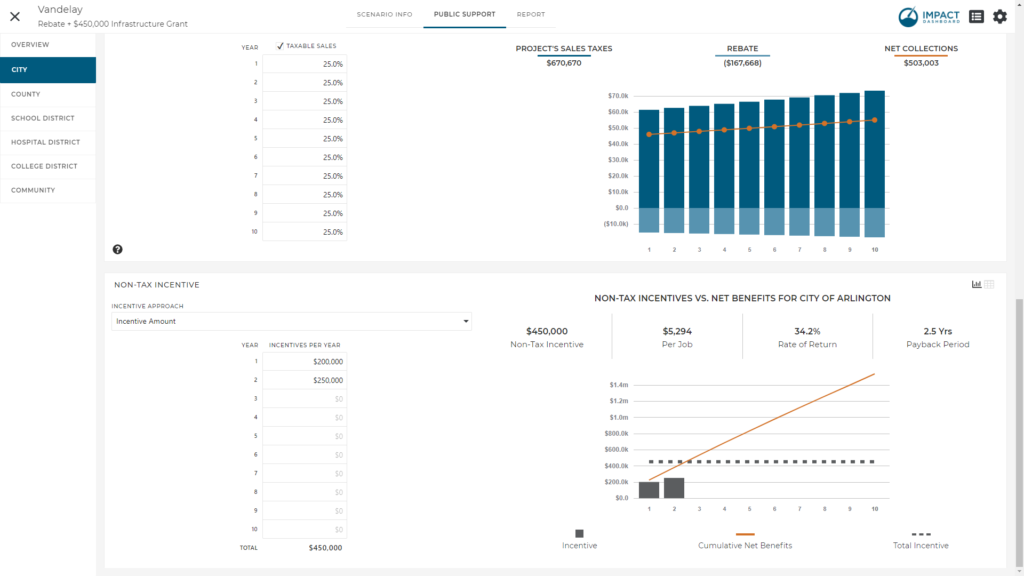
The Non-Tax Incentive is treated as an investment in the Project and the return on the investment is represented by the Net Benefit generated for the Taxing District. Impact DashBoard calculates the rate of return and payback period based on the investment and stream of net benefits.
You can specify the Non-Tax Incentive using one of four different approaches.
- Choosing Incentive Amount from the Incentive Approach dropdown, you can enter a specific dollar amount of the incentive each year.
- The Incentive Per Job option in the Incentive Approach dropdown allows you to specify a non-tax incentive amount that will be applied to the Project’s direct hiring schedule. If employment is phased-in over multiple years, the Incentive Per Job will correspond to the year the employees are hired.
- The Rate of Return option in the Incentive Approach dropdown allows you to specify a desired average annual rate of return and Impact DashBoard will determine the corresponding incentive. The average annual rate of return is discussed below.
- You can choose Payback Period in the Incentive Approach dropdown. This selection allows you to specify a desired Payback Period and Impact DashBoard will determine the corresponding incentive. The payback period is discussed below.
The Non-Tax Incentives vs. Net Benefits analysis on the right side of the Public Support page illustrates four incentive metrics and graphically compares the investment (non-tax incentive) to the return on investment (cumulative net benefits).
- Non-Tax Incentive is the total Non-Tax Incentive being considered by the Taxing District.
- Incentive Per Job is the total Non-Tax Incentive divided by the total number of direct jobs.
- Rate of Return is the average annual rate of return as calculated by dividing the average annual net benefit by the non-tax incentive.
- Payback Period identifies the point in time that the Taxing District will collect cumulative net benefits equal to the amount of the Non-Tax Incentive.
Note: For the purpose of the payback period calculation, net benefits are assumed to be collected consistently (linearly) throughout the year. In the event the Non-Tax Incentive exceeds the net benefits to be received by the Taxing District over the period of analysis, Impact DashBoard attempts to estimate the payback period by projecting future net benefits by assuming a 3% annual increase in annual net benefits beyond the final year. This payback period estimate may differ from the actual payback period if the Scenario is extended past the actual payback period.
Community Non-Tax Incentive
The Community Non-Tax Incentive is unique compared to all other incentives in Impact DashBoard because it compares an incentive provided on behalf of multiple Taxing Districts instead of a single Taxing District. Typically, a Property Tax Incentive, Sales Tax Incentive, or a Non-Tax Incentive is compared against the revenue that a single Taxing District alone will receive as a result of the Project. In the case of a Community Non-Tax Incentive, you can compare an incentive against the combined net benefits generated.
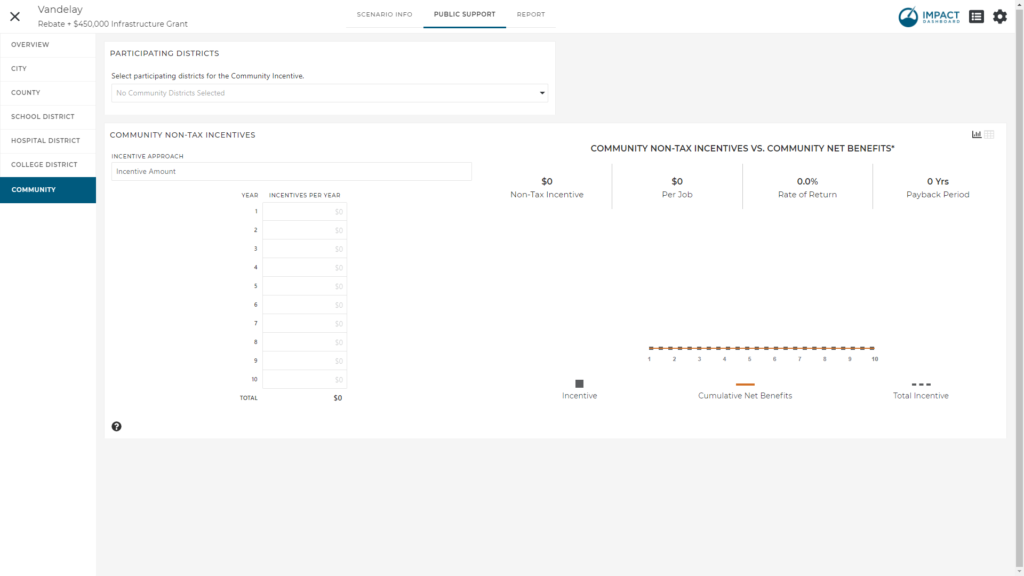
To model an incentive provided on behalf of the community (or simply two or more Taxing Districts), click on the “Community” tab of the Public Support page. Next, identify the Participating Districts for the Community Incentive analysis. Let’s assume you want to evaluate an incentive provided on behalf of the City and County. You would select the City and County in the Participating Districts dropdown. As you make this selection, you will see the Cumulative Net Benefits update in the Community Non-Tax Incentives vs. Community Net Benefits in the graph. The Cumulative Net Benefits in the Community Non-Tax Incentive analysis will represent the combined Cumulative Net Benefits of all districts selected.
Next, choose your incentive approach as described in full detail in the Non-Tax Incentive section. The non-tax incentive here will be compared to the combined cumulative net benefits to generate a rate of return and payback period for the combined Participating Districts.
The Community Non-Tax Incentive allows you to allocate the total Community Non-Tax Incentive to the Participating Districts. For example, you might choose “Equal Share” and each district will be allocated an equal share of the total incentive. You might choose “Proportional to Net Benefits” and each district will be allocated a portion of the incentive equal to its contribution to the combined Net Benefits for participating districts. You may also choose “Custom” and enter individual percentages that add up to 100%.
Based on your allocation, the rate of return and payback will be calculated for the individual districts and overall.
TIF District
If you enabled the TIF District on the Settings page (xlinkx), you will see a TIF District tab on the Public Support page. From within the TIF Distict section on the Public Support page, you can apply a Non-Tax Incentive Tax where the revenues contributed to the TIF Distirct serve as the return on investment.
TIF District & Community Non-Tax Incentive
If your Project includes a TIF District, you may want to compare the amount of TIF funds (the Non-Tax Incentive) contributed to the Project against the revenues to the TIF District as well as the net benefits received by other contributing Taxing Districts.
For example, consider a TIF Distirct where the city and county contribute property taxes to the TIF District. Assume that the TIF District will pay for infrastructure improvements for the Project. To take the broadest view of this investment by the city, county, and TIF District, you can model the infrastructure improvements on the Community tab of Public Support by identifying the city, county and TIF District as participating districts and entering a Non-Tax Incentive equal to the infrastructure improvements.
See an example here. xlinkx