Impact DashBoard Knowledge Base
Scenario Info
The Scenario Info page contains impact-related project-specific inputs for a Scenario. A description of each input is provided below.
It should be noted that the Scenario Info inputs are a subset of the inputs contained on the more comprehensive data page called Scenario & Company Info. The Scenario Info inputs represented a curated list of just the most important inputs relevant to preparing an impact analysis. Scenario Info excludes qualitative and Company inputs which can be found on the more comprehensive page called Scenario & Company Info.
Basics
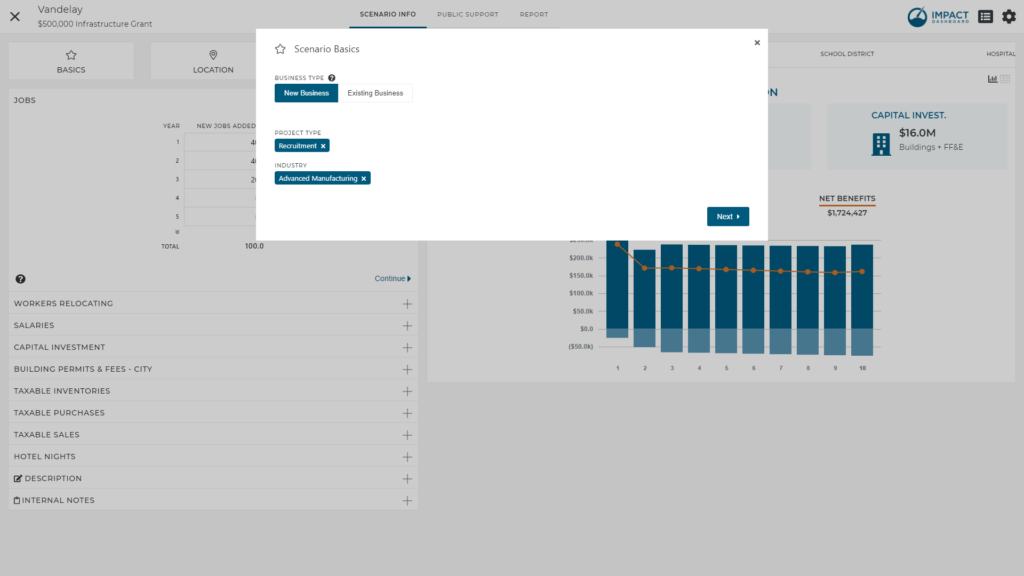
The Basics modal includes inputs for the Scenario title, Business Type, Project Type, and Industry.
Business Type indicates if the business under analysis is a New Business to your community or an Existing Business that already operates in your community.
The Basics modal also includes access to Project Type and Industry. These two inputs can also be assigned on the Projects page and the Project Control Center page.
Location
The Location modal includes inputs to identify Taxing Districts and a Project Location address or coordinates.
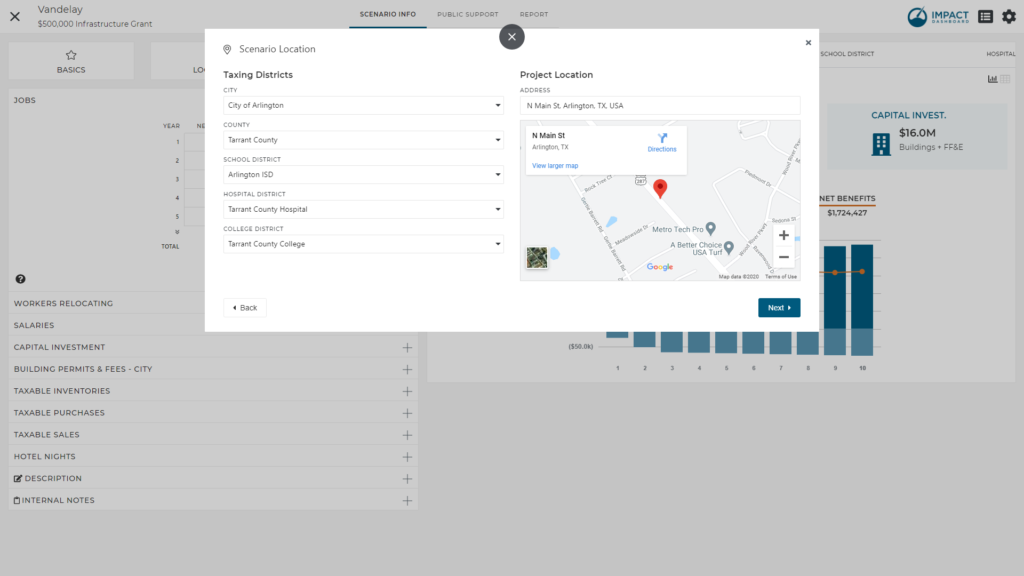
Taxing Districts
Taxing Districts identify the underlying tax structure on the model. Your model will include relevant Taxing Districts for your area and you should select which Taxing Districts will be affected by the Project. Some clients may only have a single city, county, and school district included in the Taxing District section making this step unnecessary. However, models that cover a large geographic region may have many Taxing Districts included in the account. It is important to accurately identify Taxing Districts that will be affected by a Project.
Taxing Districts affect the entire Impact DashBoard model. Your model will calculate the costs and benefits of the associated Scenario for only those districts chosen on the Taxing Districts section. Accordingly, Public Support can be modeled for only those districts chosen ion the Taxing Districts section. Individual infographic reports will be available for only those districts chosen in the Taxing Districts section.
Project Location Map
A physical address or coordinates may be entered in the Project Location input. The location will be identified by a pin on the map visible on the screen.
Note: The Project Location input and Taxing Districts are does not connected in anyway. That is to say, the two inputs are completely independent. While you may enter a location for the map, you MUST enter the Taxing Districts in order for Impact DashBoard to calculate properly.
NAICS
You can identify a six-digit NAICS code in the NAICS modal and choose to incorporate indirect and induced spin-off economic impacts into the analysis. Entering a NAICS code in this modal will pull in Type II employment and earnings multipliers. Impact DashBoard uses RIMS II multipliers from the Bureau of Economic Analysis. The multipliers built into your model are region specific and your industry selection ensures the multipliers are also industry specific.
After typing a minimum of four characters, the NAICS input will search among available NAICS codes based on the numbers or text that you enter a partial or full six-digit North American Industry Classification System (NAICS) code or some words describing the industry.
You should identify the NAICS code corresponding to the activities to be conducted in the community. If an auto manufacturer is locating its headquarters, select the code for headquarters operations instead of auto manufacturing. If the local facility will engage in two distinct activities, you may contact Impact DataSource for assistance in entering custom multipliers that represents the job-weighted average of the two distinct activities.
How to Interpret the Multipliers
The Type II Employment Multiplier represents the total change in employment associated with one additional job in that industry. For example, a Type II Employment Multiplier of 1.5 means that for each direct job created, there will be 1.5 TOTAL jobs created in the community. This includes the 1 direct job and 0.5 indirect and induced jobs.
The Type II Earnings Multiplier represents the total change in earnings for each dollar earned by the direct workers. For example, a Type II Earnings Multiplier of 1.4 means that for each dollar paid to a direct worker, there will be $1.40 TOTAL paid to all of the workers in the community. This includes the $1 paid to the direct worker and $0.40 paid to indirect and induced workers.
Remove Indirect and Induced Spin-off Impacts
In some instances, you may wish to remove all spin-off impacts from a Scenario. This can be useful to determine how the spin-off impacts affect the overall net benefits for a Project. In order to remove indirect and induced spin-off impacts from Impact DashBoard, simply uncheck the input for “Include Spin-off Impacts” on the NAICS modal. Alternatively, you can enter custom multipliers on the NAICS modal equal to 1 for both the Type II Employment and Earnings Multiplier.
Preventing the Overestimation of Impacts at the Sub-County Level
Generally speaking, the multipliers used in Impact DashBoard represent the district-specific multiplier. In the case of a county, the multipliers represent the RIMS II multipliers as produced by the Bureau of Economic Analysis. In the case of sub-county areas – areas for which RIMS II multipliers are not produced by the Bureau of Economic Analysis – Impact DataSource applies a methodology to avoid overestimating the impact at the local level. For example, most cities represent a subset of the entire county. Impact DataSource makes an adjustment to the county-level multiplier to estimate the city-level multiplier based on the relative concentration of countywide employment occurring in the city. As a result, you may notice that the employment impact in the county is larger than the employment impact in the city.
Current Operations
The Current Operations input is dependent on the Business Type selected on the Basics modal. If the Business Type is an Existing Business, you will see a section to enter details about the company’s Current Operations. If the Business type is a New Business, you will not see the Current Operations section.
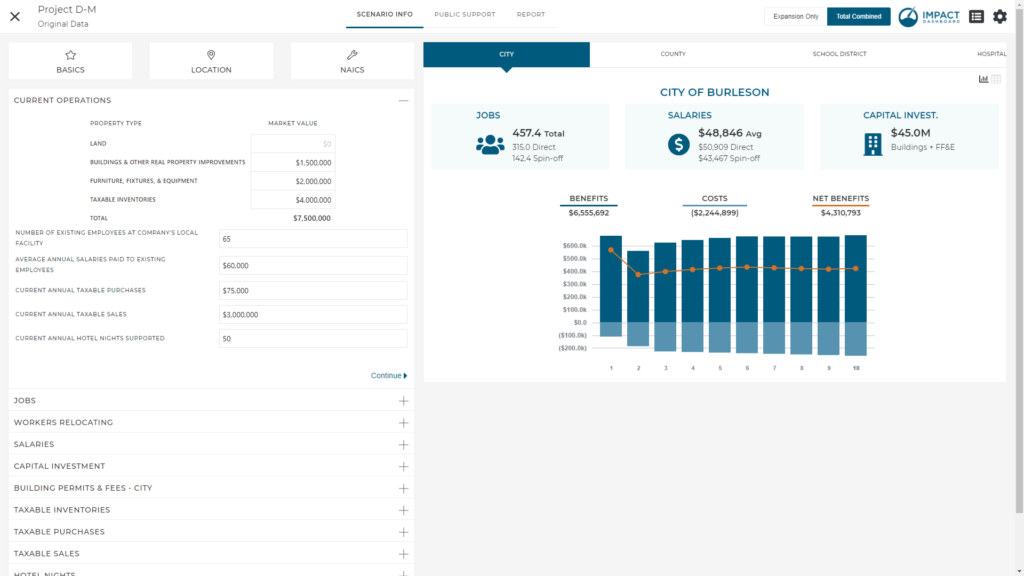
The Current Operations inputs include
- Market Value of the Company’s Property
- Number of Existing Employee’s Employed at the Company’s Local Facility
- Average Annual Salaries Paid to Existing Employees
- Current Annual Taxable Purchases
- Current Annual Taxable Sales
- Current Annual Hotel Nights Supported
These inputs will be used to estimate the value supported by the company’s current operations.
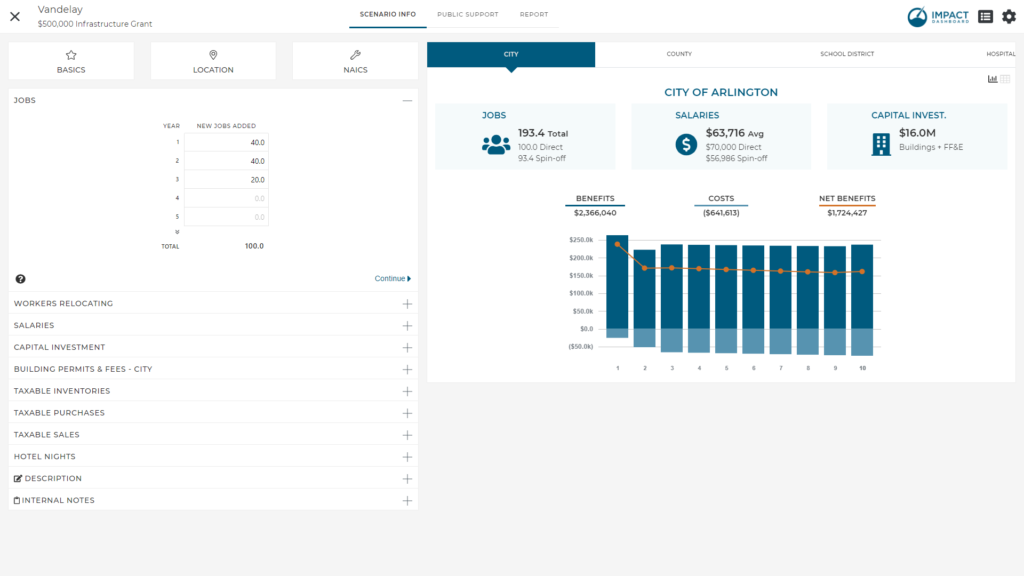
Jobs
The Jobs input accepts the employment estimates used in the model. The input requires the user to enter the new jobs added each year. Prospects will sometimes provide data in terms of the total cumulative jobs to be hired so it is important that you only enter the incremental jobs added each year. The total is automatically calculated at the bottom of the Jobs input to help clarify the incremental jobs sum to the total expected.

If the company is relocating from outside of the area, the Year 1 value should include jobs transferred to the community in Year 1 and any new jobs created, if any.
If the Project represents a retention project, you should enter retained jobs in the Current Operations section of the Scenario Info screen. Do not enter retained jobs in the Jobs input without manually adjusting the worker relocation assumptions. The Jobs input is intended for newly hired or relocated positions and may affect the community’s population.
Workers Relocating
The Workers Relocating input accepts an estimate of the percent of workers that will relocate to the community from somewhere else. When new jobs are created in a community, the workers who will fill those positions may represent (1) existing residents, (2) nearby residents that will commute to the community to work, and (3) new residents that will relocate the community to fill one of the positions created. The Workers Relocating input is interested in this third possibility.
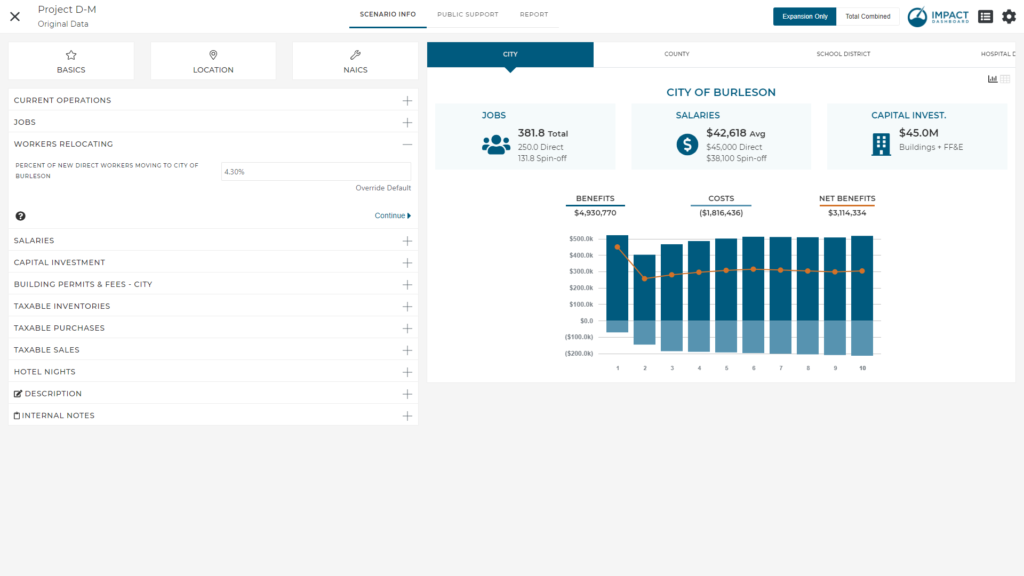
Impact DashBoard includes a baseline default value for the Workers Relocating assumption based on existing community patterns and generally how likely it is for someone to work and also live in the community.
While working on a Scenario, you may know additional information that will help inform this Workers Relocating assumption. For example, if the company is relocating from outside of the state, the company may be able to indicate the number of existing workers it plans to relocate to the area. You may make an assumption about a subset of those relocating workers that will ultimately settle in your community.
Additionally, you may consider how the local labor force matches the positions to be hired. If the local labor force (residents and commuters) will be able to fill all of the new positions, you may reduce the workers relocating assumption.
Finally, depending on the average salary paid to the new workers, you may be able to determine if new workers would be more or less likely to relocate to the area.
Importance of Workers Relocating
The Workers Relocating assumption is an important parameter in the Impact DashBoard model. The Workers Relocating assumption affects the population impact resulting from a Project which, in turn, directly affects the fiscal impact on municipalities, counties, and school districts.
Population impacts filter through the model in a number of ways. For example, the greater number of people relocating to an area may result in new residential property being constructed and resulting property taxes. Additionally, some revenues may be estimated based on the number of new households relocating to a community. Local governments may also bear additional expenditures to provide services to the new households. Accordingly, additional costs are estimated based on the number of new households relocating to a community.
Salaries
The Salaries input accepts the average annual salary paid to new workers. The input allows you to enter a value in Year 1 and adjust the Percent Annual Increase to populate the average salary throughout the time period. You can adjust the Percent Annual Increase or change individual average salary inputs as desired.
The average salary is simply the total payroll divided by the number of workers.
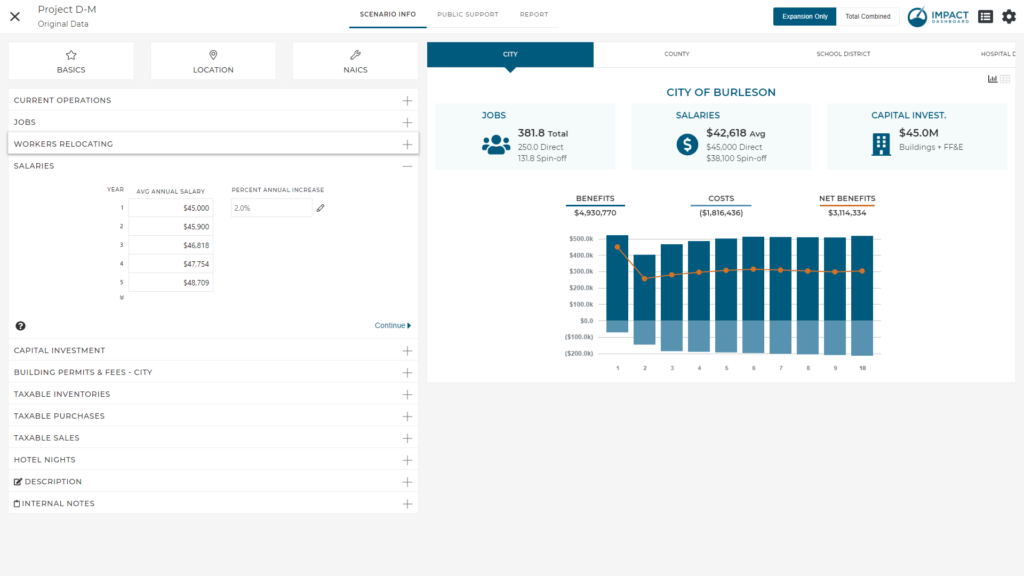
The average salary will be used to estimate total earnings impact including earnings paid to all direct and spin-off workers. The average salary will be used to estimate sales tax generated by workers spending some of their earnings on local taxable goods and services, if applicable, as well as to estimate local income tax, If applicable.
Capital Investment
The Capital Investment section includes inputs for the value of Land as well as capital investments “Buildings and Other Real Property Improvements”, and “Furniture, Fixtures, and Equipment”.
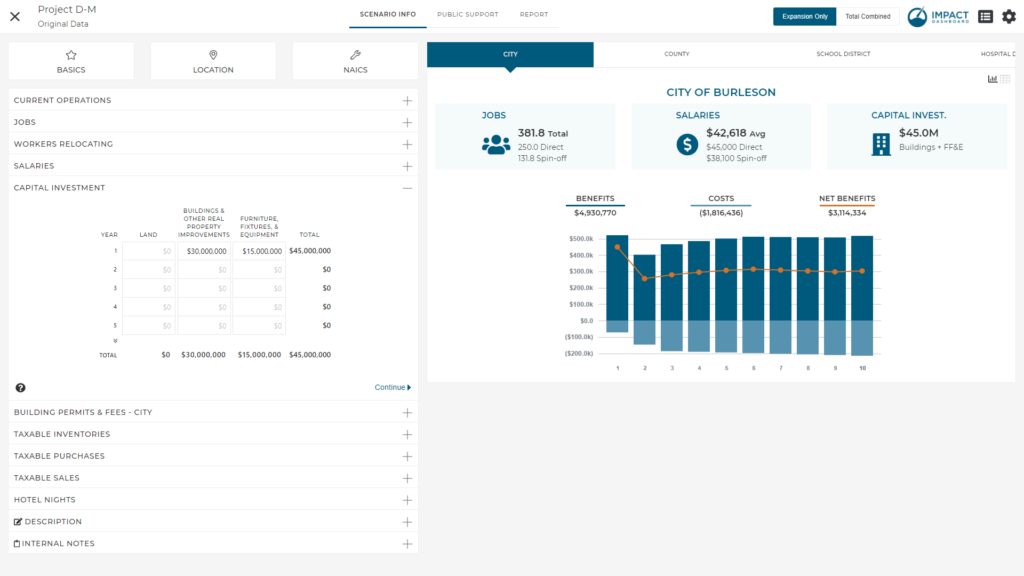
The inputs in the Capital Investment section will be used as the basis of the calculations to determine the taxable value of property. The calculations used to transform these inputs into taxable value are described below.
Land
The value of Land can be entered into the model, if desired. However, land is usually disregarded in our impact analyses in an attempt to focus on only the incremental property added to the tax rolls. If the land is currently on the tax rolls, it is our suggestion to disregard the value of the land. However, there are a few instances when you may consider including the value of the land in the impact analysis.
First, if the land was owned by the city or otherwise previously exempt from taxes and will now be owned by a private property owner and added to the tax rolls, then the value of the land should be included in the analysis. Similarly, if the land will be annexed by the city as a result of the Project and now this land represents an increase in taxable property to the city, then the value of the land should be included in the analysis.
Secondly, if you wish to perform an analysis that simply summarizes the taxes supported by the firm in a broad sense, you could consider including the land to account for the property taxes on land that the company supports.
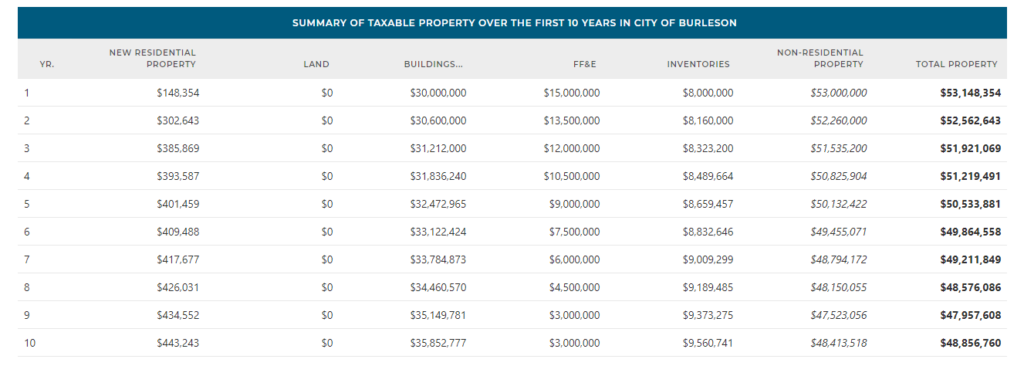
Taxable Value of Land
The taxable value of land is determined by multiplying the value of land entered in the Capital Investment section by the assessment ratio. The taxable value of land can be seen in the Economic Impact Overview section of the Detailed Report. Over time, the land value may increase or decrease based on the Commercial/Industrial Real Property Assumption on the Settings > General Assumptions page. Click here for more information on the Settings page. xlinkx

Buildings & Other Real Property Improvements
The investment in Buildings & Other Real Property Improvements can be entered into this Capital Investment section.
By default, the investment in Buildings will be interpreted as the cost of construction. You have the ability to change this default unchecking the box on the Settings > General Assumptions tab indicating “Buildings and other Real Property Improvements are Associated with Construction”.
In cases where the Building investment is associated with construction local sales taxes will also be calculated, if applicable. Assumptions exist for the percent of Building costs associated with (1) Materials and (2) Labor. Typical defaults are 50% materials and 50% labor but these parameters can be adjusted. Additionally, an individual Taxing District will include parameters indicating what percentage of materials are purchased locally and subject to local sales tax. The Labor portion of construction expenditure may also result in taxable sales made by construction workers subject to parameters for construction worker spending.
Taxable Value of Buildings & Other Real Property Improvements
The taxable value of the Building is determined by multiplying the Buildings & Other Real Improvement value entered in the Capital Investment section by the “Percent of Building and Improvement Costs Added to Local Tax Rolls” and again multiplying that result by the assessment ratio. The taxable value of the Building can be seen in the Economic Impact Overview section of the Detailed Report. Over time, the Building value may increase or decrease based on the “Commercial/Industrial Real Property Assumption” on the Settings > General Assumptions tab. Click here for more information on the Settings page. xlinkx

Furniture, Fixtures, & Equipment (FF&E)
The investment in Furniture, Fixtures, & Equipment can be entered into this Capital Investment section.
If applicable, local sales taxes will be estimated on the initial purchases of FF&E. An individual Taxing District will include parameters indicating what percentage of FF&E are purchased locally and subject to local sales tax.
Taxable Value of FF&E
The taxable value of the FF&E is determined after applying the depreciation schedule (“Percent Market Value of FF&E by Year”) and the assessment ratio. The Percent Market Value of FF&E by Year schedule can be viewed and modified on the Settings > General Assumptions tab. Click here for more information on the Settings page. xlinkx
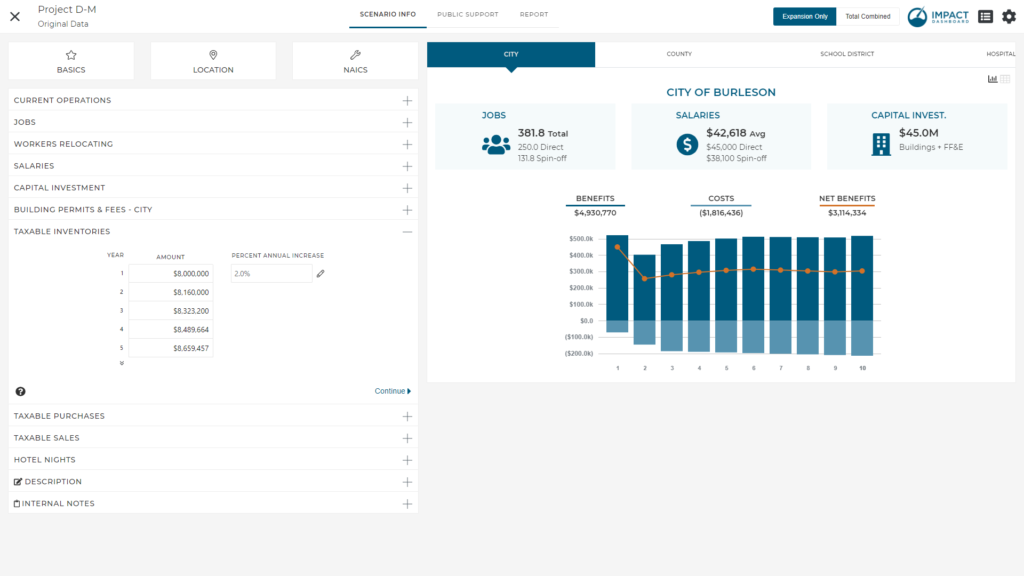
Taxable Inventories
The Taxable Inventories input accepts the taxable inventories associated with a Project. The input allows you to enter a value in Year 1 and adjust the Percent Annual Increase to populate the taxable inventories throughout the time period. You can adjust the Percent Annual Increase or change individual inventory inputs as desired.
Not all states tax inventories so not all users will be asked to complete this input.
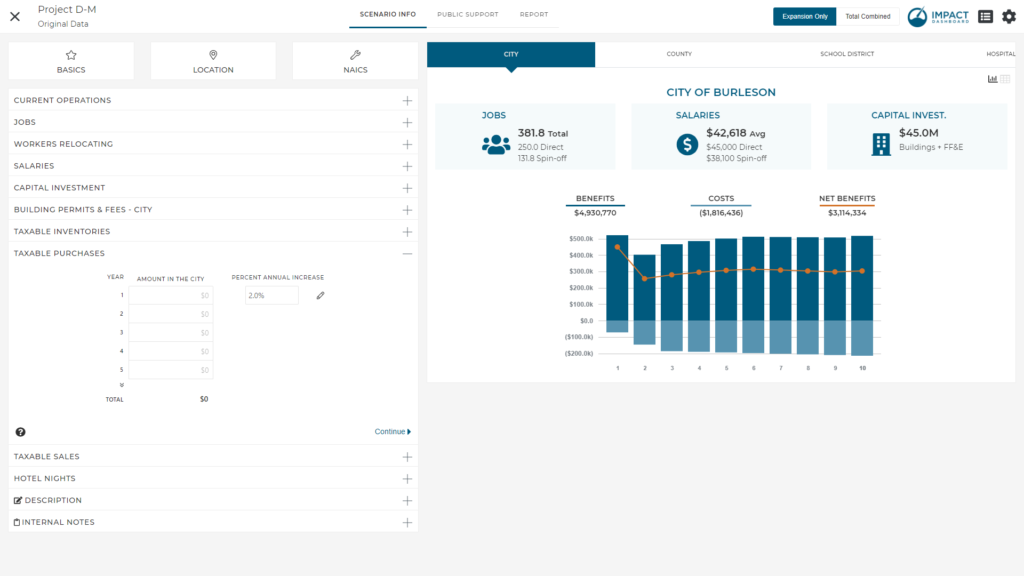
Taxable Purchases
The Taxable Purchases input accepts the Project’s taxable purchases of materials, supplies, and services. You should not include purchases of FF&E identified in Capital Investment section.
In many instances this input will be negligible or unknown. When in doubt, leave this blank.
Taxable Sales
The Taxable Sales input accepts the taxable sales associated with a Project. The input allows you to enter a value in Year 1 and adjust the Percent Annual Increase to populate the taxable sales throughout the time period. You can adjust the Percent Annual Increase or change individual taxable sales inputs as desired.

It is important to note that the input is specific to the local taxable sales. If the Project has taxable sales but those sales won’t be subject to the local sales tax rate, do not enter any value in this input.
Very often this input will be left blank because many common economic development projects such as manufacturers or headquarters locations won’t have any taxable sales. In the case of a retail development or a restaurant, this input will likely be very critical.
Hotel Nights
The Hotel Nights input accepts the number of annual hotel nights supported by a Project, as well as the average daily hotel rate, and general visitor spending per hotel night. The input allows you to enter a value in Year 1 and adjust the Percent Annual Increase to populate the inputs throughout the time period. You can adjust the Percent annual Increase or change individual inputs as desired.
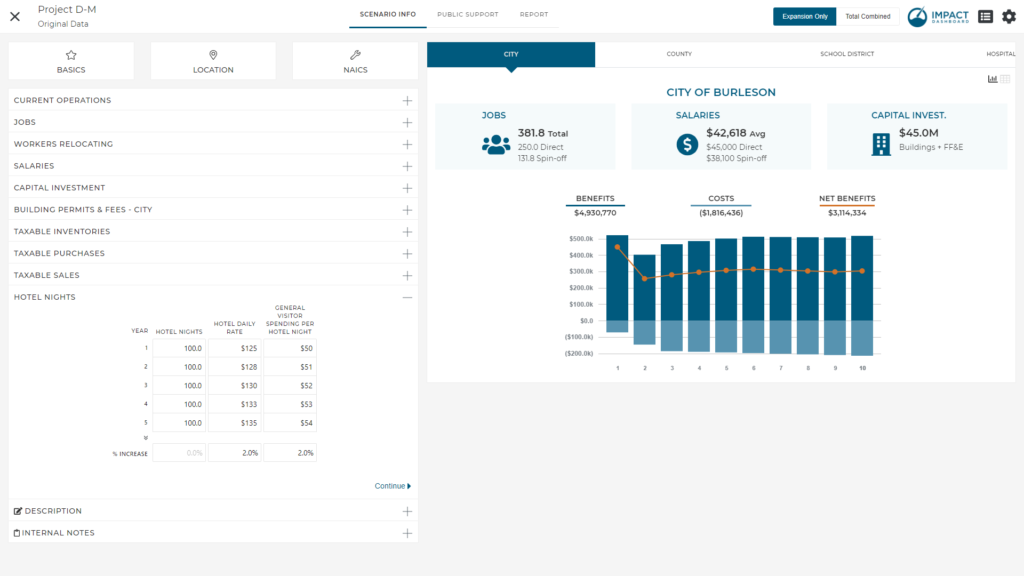
Hotel lodging spending and visitor taxable spending will be calculated in order to estimate hotel taxes and additional sales taxes, if applicable. Hotel lodging spending is the simply the number of hotel nights multiplied by the hotel daily rate. Taxable visitor spending is the number of hotel nights multiplied by the general visitor spending per hotel night.
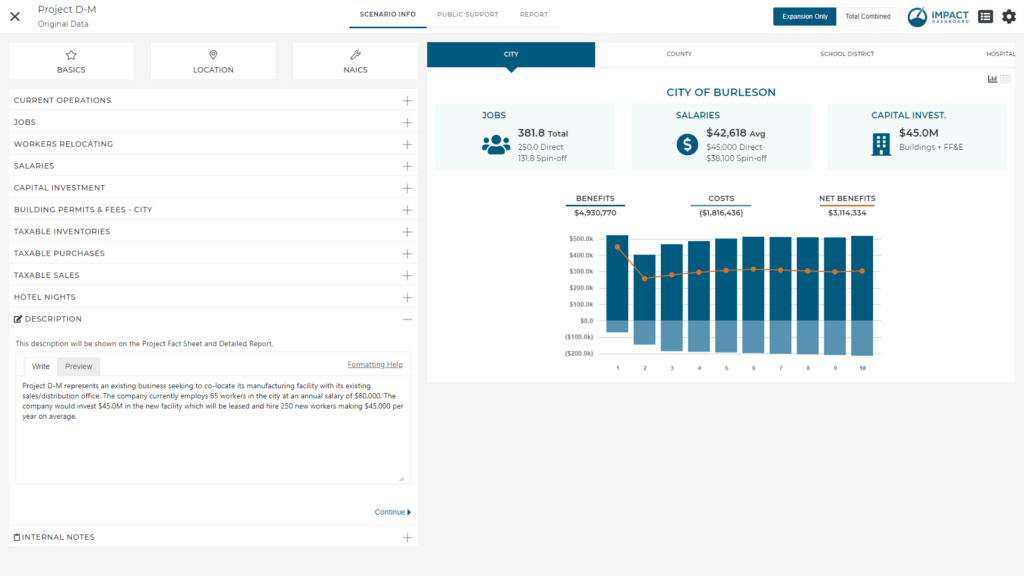
Description
The Description input accepts a text description of the Project. The text description of the Project will appear in the Detailed Report in a section called Description of the Project.
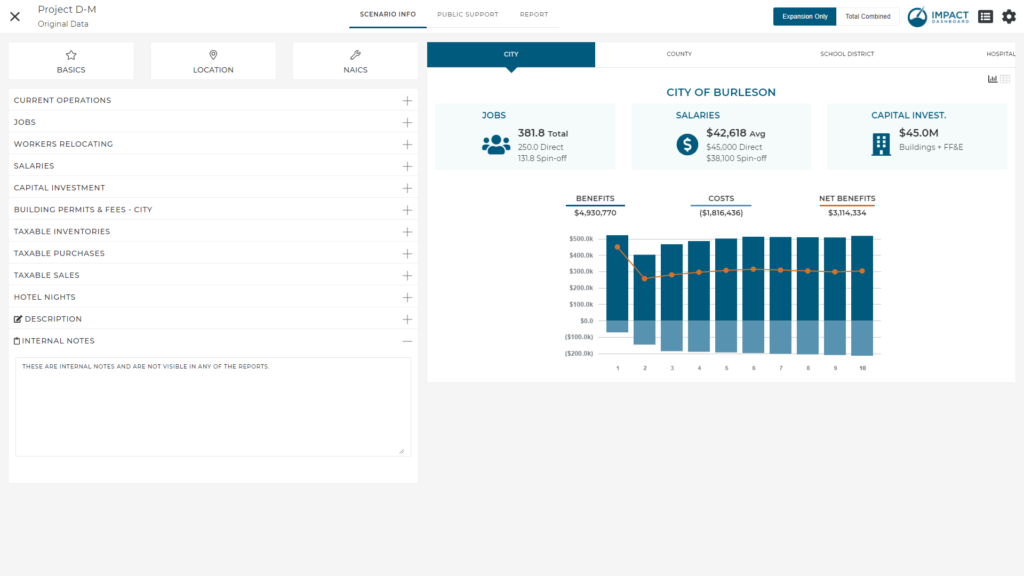
Internal Notes
The Internal Notes input accepts text notes that you may find helpful to associated with the Scenario. The Internal Notes do not appear in any of the reports.