Impact DashBoard Knowledge Base
How to Interpret Non-Tax Incentive Analysis
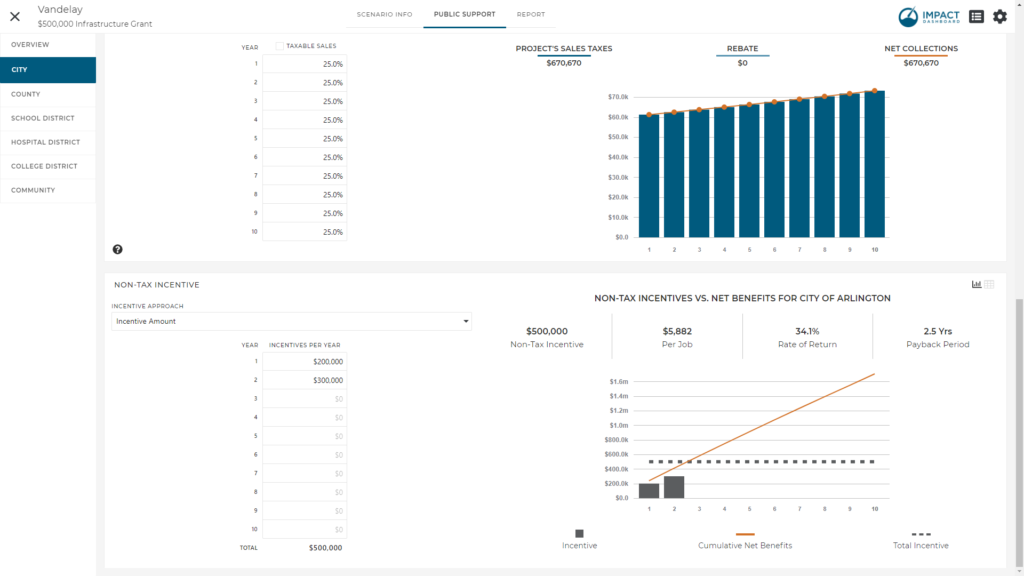
The Non-Tax Incentive is generic term for any additional cash or near cash incentive you would like to evaluate. Examples of Non-Tax Incentives could be a job creation grant, an infrastructure grant, the value of waived fees, the value of free or discounted land, or any other incentive that you can value in dollar terms.
The Non-Tax Incentive is treated as an investment in the Project and the return on the investment is represented by the Net Benefit generated for the Taxing District. Impact DashBoard calculates the rate of return and payback period based on the investment and stream of net benefits.
You can specify the Non-Tax Incentive using one of four different approaches.
- Choosing Incentive Amount from the Incentive Approach dropdown, you can enter a specific dollar amount of the incentive each year.
- The Incentive Per Job option in the Incentive Approach dropdown allows you to specify a non-tax incentive amount that will be applied to the Project’s direct hiring schedule. If employment is phased-in over multiple years, the Incentive Per Job will correspond to the year the employees are hired.
- The Rate of Return option in the Incentive Approach dropdown allows you to specify a desired average annual rate of return and Impact DashBoard will determine the corresponding incentive. The average annual rate of return is discussed below.
- You can choose Payback Period in the Incentive Approach dropdown. This selection allows you to specify a desired Payback Period and Impact DashBoard will determine the corresponding incentive. The payback period is discussed below.
The Non-Tax Incentives vs. Net Benefits analysis on the right side of the Public Support page illustrates four incentive metrics and graphically compares the investment (non-tax incentive) to the return on investment (cumulative net benefits).
- Non-Tax Incentive is the total Non-Tax Incentive being considered by the Taxing District.
- Incentive Per Job is the total Non-Tax Incentive divided by the total number of direct jobs.
- Rate of Return is the average annual rate of return as calculated by dividing the average annual net benefit by the non-tax incentive.
- Payback Period identifies the point in time that the Taxing District will collect cumulative net benefits equal to the amount of the Non-Tax Incentive.
Note: For the purpose of the payback period calculation, net benefits are assumed to be collected consistently (linearly) throughout the year. In the event the Non-Tax Incentive exceeds the net benefits to be received by the Taxing District over the period of analysis, Impact DashBoard attempts to estimate the payback period by projecting future net benefits by assuming a 3% annual increase in annual net benefits beyond the final year. This payback period estimate may differ from the actual payback period if the Scenario is extended past the actual payback period.