
New Features are Live on Impact DashBoard! (9/14/2020)
Click Submit Your Data to see the new Data Form Wizard as a Prospect would experience it.
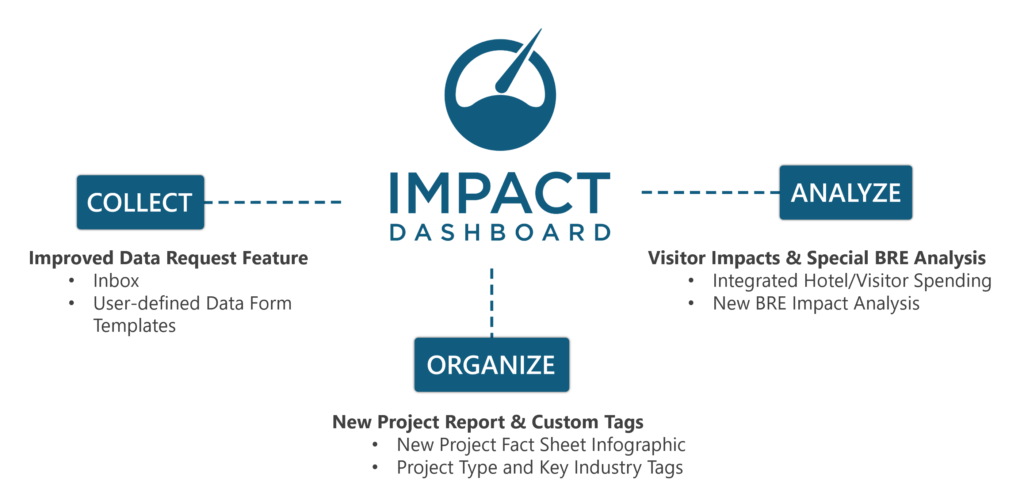
The latest update to Impact DashBoard includes:
- Data Form Inbox & Templates
- Project Fact Sheet Report
- Project Type & Industry Tags
- BRE Impact Analysis
- Hotel Nights & Taxes + Visitor Spending
Navigate through the sections below for instruction and additional resources on the new features.
Data Form Inbox & Templates
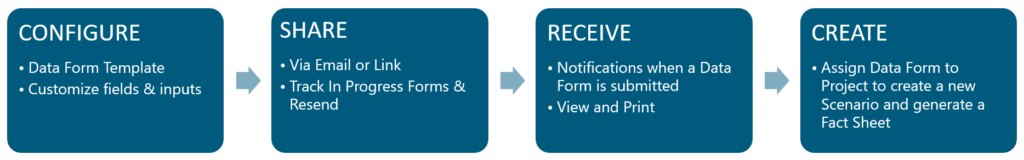
You can now configure a Data Form Template to gather the relevant project and company information from prospective businesses interested in your community. You can select which questions you’d like to include on the Data Form from a common list and customize various fields.
Learn more about the data form new features and how to configure them using the following link:
Configure a Data Form Template
**If you’d like help configuring your new data form templates, schedule a time to meet with Nicole here.
There are now two ways to share your Data Form with Impact DashBoard:
- You can email a link to your Data Form to a prospect directly from Impact DashBoard so that the prospect can submit their project information to you. (Learn How Here)
- Alternatively, you can post a link to your Data Form on your website or anywhere else that will allow any visitor to submit their project information to you. (Learn How Here)
In addition, users can organize received data forms in their new Impact DashBoard inbox and can also assign data forms to specific projects. Find out more: Manage Data Submissions
Not only is the data collection process updated on your side, but your prospect’s experience submitting project information will take them to a new data collection wizard. The Data Form Wizard has been designed to be an engaging, dynamic, and easy way for you to gather economic development project data. Find out more: Your Prospect’s Experience with the Data Form Wizard
Project Fact Sheet Report
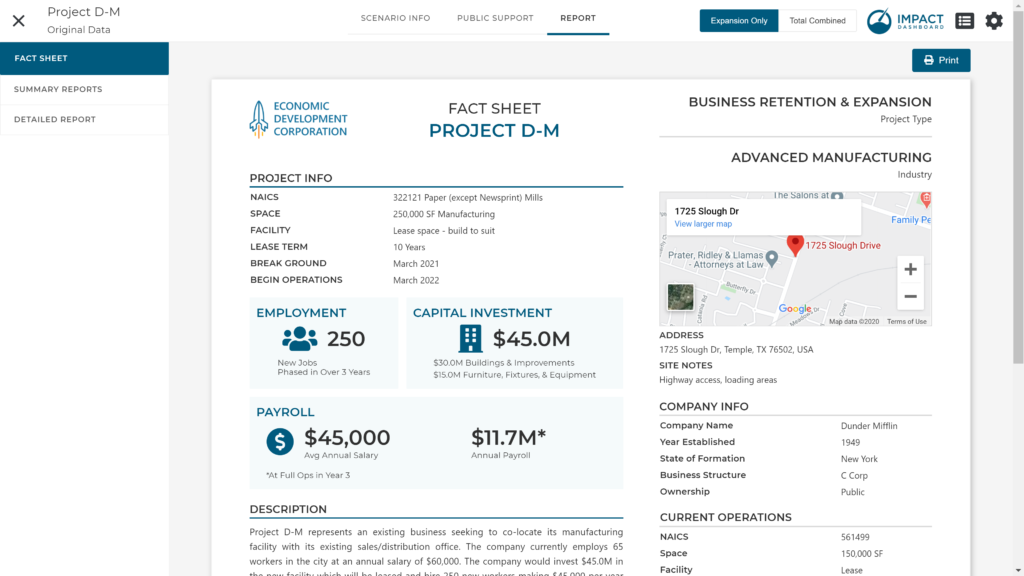
The Fact Sheet Report presents the basic “facts” about the project, the company, and its plans. The Fact Sheet report includes qualitative and quantitative details about the project. Employment, Capital Investment, and Payroll/Salaries are highlighted on the Fact Sheet as well the NAICS code, square feet desired, project plans, and background on the company.
The Fact Sheet is a one-page infographic representation of the detailed Scenario & Company Info. The Fact Sheet does not incorporate spin-off economic benefits from the project or tax calculations – it just sticks to the facts!
Project Type & Industry Tags
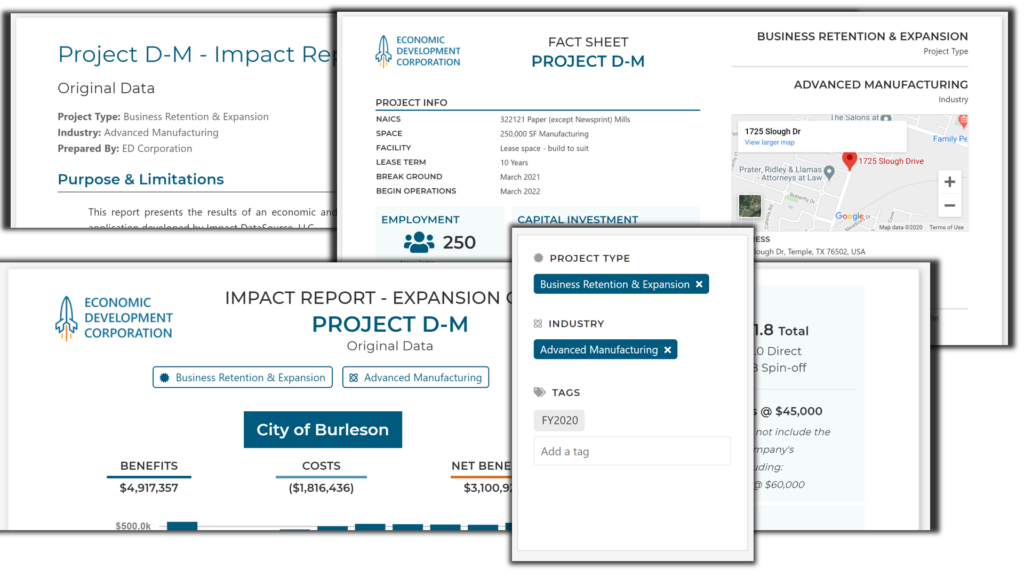
Project Types are user-defined categories that can be used to reflect your organization’s internal project type terminology. For example, the default Project Types included in Impact DashBoard include:
- Business Retention & Expansion
- New/Startup
- Recruitment
Industries are user-defined categories that can be used to reflect your organization’s target industries or key industry categories. The Industry classification is intended to match the broad sector in your own words.
Note, a detailed NAICS code can be identified within a Scenario. The Industry category is intended to be more general and encompass a broader Industry grouping.
To create or edit user-defined Project Type and Industry categories, click on the Customization page of the My Account area.
Learn more about how to create and use these project labels:
BRE Impact Analysis
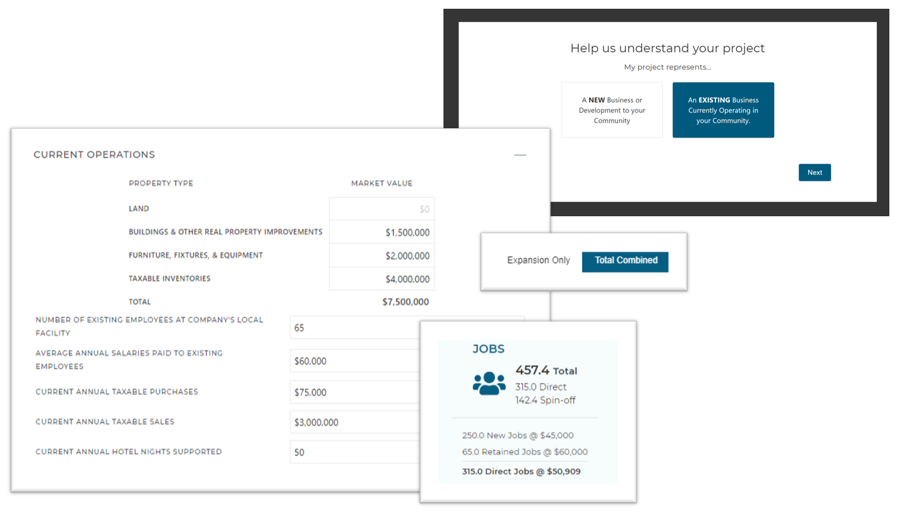
Users can now work through their BRE projects in Impact DashBoard and can analyze the results based on the expansion only or the total combined impact of the existing operations and expansion. Assessing BRE projects will allow users to input the company’s current operations (before the expansion), including:
- Market Value of Property
- Number of Existing Employees
- Current Annual Salary
- Current Taxable Sales and Purchases
- Current Hotel Nights Supported
To get started, jump into a project scenario and in the Scenario Basics modal, indicate that the company is an “Existing Business,” meaning that they already have operations in your community. Next, choose whether there is an expansion element or if you want to focus solely on current operations. Once these steps are completed, a Current Operations input box will populate towards the top of the Scenario Info page.
Hotel Nights & Taxes + Visitor Spending
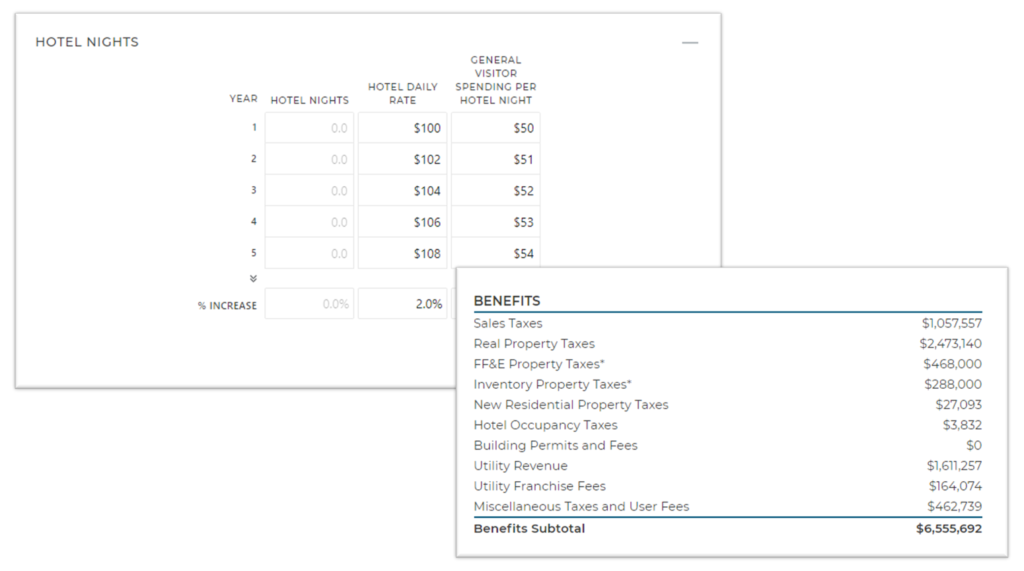
Impact DashBoard now includes inputs for users to collect more information on local spending that a business’ visitors may contribute to the local economy. The inputs can be found on the Scenario Info page in the “Hotel Nights” section. Inputs include:
- Number of Hotel Nights
- Hotel Daily Rate
- General Visitor Spending per Hotel Night
Once completed, the report will include Hotel Occupancy Taxes.
Related Article: